21. Overview of digitised books#
On this page
21.1. Finding digitised books#
Trove includes thousands of digitised resources described as books. You can find them by using the standard search strategy for digitised resources – search for "nla.obj" in the Books & Libraries category with the availability facet set to y, and the format facet set to Book.
You might want to filter these results further, for example:
exclude books that are not freely available online by setting the
availabilityfacet toy/f– this should exclude books uploaded through the National E-Deposit scheme which can only be accessed onsiteexclude all books uploaded through the National E-Deposit scheme by adding
NOT nuc:"ANL:NED"to your queryexclude Parliamentary Papers by adding
NOT series:"Parliamentary paper (Australia. Parliament)"to your query
You’d expect all the books to be in the Books & Libraries category, but keeping in mind the basic principle to ‘always assume that Trove isn’t telling you everything’, you might want to look for books in other categories as well. If you’re using the API this is easy to do by setting category to all and bulkHarvest to true.
21.2. How many digitised books are there?#
I’ve created a dataset of digitised books in Trove by using the basic search strategy outined above and excluding Parliamentary Papers. Harvesting data about digitised resoures is tricky because of the way they’re described and grouped. To workaround these problems, I used the method described in HOW TO: Harvest data relating to digitised resources to process all versions, exclude records without a fulltext identifier, add in multi-volume works and other collection groupings, and merge duplicate records using their fulltext identifier. I then attempted to download OCRd text from the books. The resulting dataset is available on GitHub.
You can use this dataset to investigate the characteristics of Trove’s digitised books. For example, how many book records are there in the dataset?
Show code cell source
import pandas as pd
df = pd.read_csv(
"https://raw.githubusercontent.com/GLAM-Workbench/trove-books-data/main/trove-books.csv",
keep_default_na=False,
)
print(f"There are {df.shape[0]:,} book records!")
There are 21,218 book records!
How many of the books have OCRd text you can download?
Show code cell source
print(f"{df.loc[df['text_file'] != ''].shape[0]:,}")
17,695
Why wouldn’t a digitised book have OCRd text? I suspect it’s because some of the so-called books are actually leaflets and posters. There are probably also some NED books in PDF or eBook formats.
21.3. What languages are they in?#
The book metadata includes a language field. This field can have multiple values.
How many different languages are recorded in the language field?
Show code cell source
languages = df["language"].str.split(" | ", regex=False).explode()
languages.nunique()
251
What are the ten most common language values?
Show code cell source
languages.value_counts().to_frame().reset_index()[:10].style.format(
thousands=","
).hide()
| language | count |
|---|---|
| English | 17,903 |
| Chinese | 1,685 |
| 518 | |
| French | 256 |
| Undetermined | 162 |
| German | 132 |
| Japanese | 95 |
| Italian | 89 |
| Austronesian (Other) | 80 |
| Dutch | 77 |
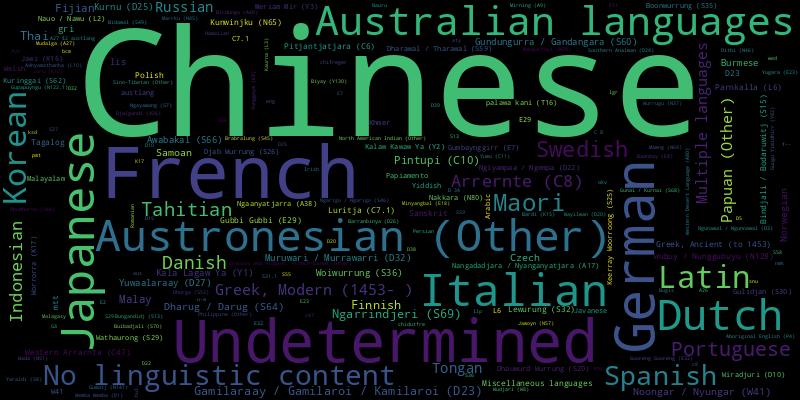
It’s no suprise that a large majority of the books are in English. To dig deeper, uou can exclude the English books and visualise the remaining language counts as a word cloud.
Show code cell source
from wordcloud import WordCloud
language_counts = languages.value_counts().to_dict()
del language_counts["English"]
wc = WordCloud(width=800, height=400)
wc.generate_from_frequencies(language_counts)
language_cloud = wc.to_image()
display(language_cloud)

Fig. 21.1 Languages of digitised books (excluding English)#
21.4. When were they published?#
You can use the date field to examine their publication dates.
Show code cell source
import altair as alt
df["year"] = df["date"].str.extract(r"\b((?:16|17|18|19|20)\d{2})\b")
year_counts = df["year"].value_counts().to_frame().reset_index()
chart_years = alt.Chart(year_counts).mark_bar(size=1).encode(
x="year:T",
y=alt.Y("count:Q", title="number of books"),
tooltip=[alt.Tooltip("year:T", format="%Y"), "count:Q"],
).properties(width="container", height=200, padding=20)
display(chart_years)
Fig. 21.2 Publication years of digitised books#
Why are there peaks in 1800, 1900, 2000? Presumably because an exact publication date was not known, so a value for the century was used.
21.5. What is the copyright status?#
The rights field includes information about copyright. This field can have multiple values, and often there’ll be both string value and a url.
Show code cell source
df["rights"].str.split(
" | ", regex=False
).explode().value_counts().to_frame().reset_index().style.format(thousands=",").hide()
| rights | count |
|---|---|
| http://rightsstatements.org/vocab/NKC/1.0/ | 17,300 |
| Out of Copyright | 15,847 |
| No known copyright restrictions | 4,493 |
| 433 | |
| In Copyright | 397 |
| Perpetual | 46 |
| Mixed copyright | 2 |
| Out of copyright | 2 |
| http://creativecommons.org/licenses/by-nc-nd/3.0/au | 1 |
21.6. What are they about?#
The subject field contains standard(ish) subject headings. There can be multiple values. The values below have been normalised to standardise spacing and remove trailing full stops.
Show code cell source
import re
def split_and_clean(value):
values = value.split("|")
return list(
set(
[
re.sub(r"(\w)--(\w)", r"\1 -- \2", v).strip().strip(".")
for v in values
if v
]
)
)
df["subjects"] = df["subject"].apply(split_and_clean)
subjects = df["subjects"].explode().to_frame()
subjects["subjects"].value_counts().to_frame().reset_index()[:20].style.format(
thousands=","
).hide()
| subjects | count |
|---|---|
| Australian | 3,456 |
| Printed ephemera -- Australia | 2,089 |
| Menus -- Specimens | 963 |
| Chinese language -- Dictionaries | 610 |
| Menus - Shipping (general, Orient, P&O) | 480 |
| Menus -- Australia -- Specimens | 470 |
| Invitation cards -- Australia | 422 |
| Programs -- Australia | 418 |
| Australia | 369 |
| Menus - General | 335 |
| Menus - Specific events | 242 |
| Commercial catalogs -- Australia | 225 |
| Australia -- Commerce -- Miscellanea | 224 |
| Business -- Australia -- Miscellanea | 224 |
| Advertising -- Australia -- Miscellanea | 219 |
| Retail trade -- Australia -- Miscellanea | 203 |
| Trade literature -- Australia | 201 |
| Industries -- Australia -- Miscellanea | 198 |
| Advertising -- Brand name products -- Australia | 181 |
| Broadsides -- Australia | 169 |
21.7. How many pages do they contain?#
The number of pages is generally not in the API data, but I’ve extracted it from the metadata embedded in the digitised book viewer. This number really represents the number of digitised images, so it can include covers and endleaves.
How many digitised pages (or images) are there in total?
Show code cell source
print(f"{df['pages'].sum():,}")
1,473,339
By ‘binning’ the page values into groups of 100 you can examine how the page lengths vary.
Show code cell source
chart_pages = alt.Chart(df).mark_bar().encode(
x=alt.X("pages:Q", title="number of pages (binned)").bin(maxbins=20),
y=alt.Y("count()", title="number of books")
).properties(
width="container", height=200
)
display(chart_pages)

