
Analysing keywords in Trove’s digitised newspapers#
You want to explore differences in language use across a collection of digitised newspaper articles. The Australian Text Analytics Platform provides a Keywords Analysis tool that helps you examine whether particular words are over or under-represented across collections of text. But how do get data from Trove’s newspapers to the keyword analysis tool?
Tools#
![]()
The Trove Newspaper & Gazette Harvester makes it easy to download large quantities of digitised articles from Trove’s newspapers and gazettes.
![]()
Use the KeywordsAnalysis tool to analyse words in a collection of corpus and identify whether certain words are over or under-represented in a particular corpus (the study corpus) compared to their representation in other corpus (the reference corpus).
Getting your own Trove API key#
The Trove Newspaper & Gazette Harvester downloads data using Trove’s Application Programming Interface (API). Access to the API is managed through the use of ‘keys’. You’ll need your own API key to use the Harvester. Fortunately, it’s quick and easy to get a key for non-commercial use. See Trove’s Using the API help page for full details, but in summary you need to:
create a Trove user account (if you don’t have one already)
login to your user account and go to your profile
click on the ‘For developers’ tab
fill in and submit the API application form
Warning
Your API key will be displayed as soon as you submit the application form, however, it can take several minutes for the key to be activated. If you receive authentication errors when you try to use the key, wait a little while and then try again.
Your API key is just a string of random letters and numbers. Any time you need it, just go back to the ‘For developers’ tab in your user profile and copy the key from the page.
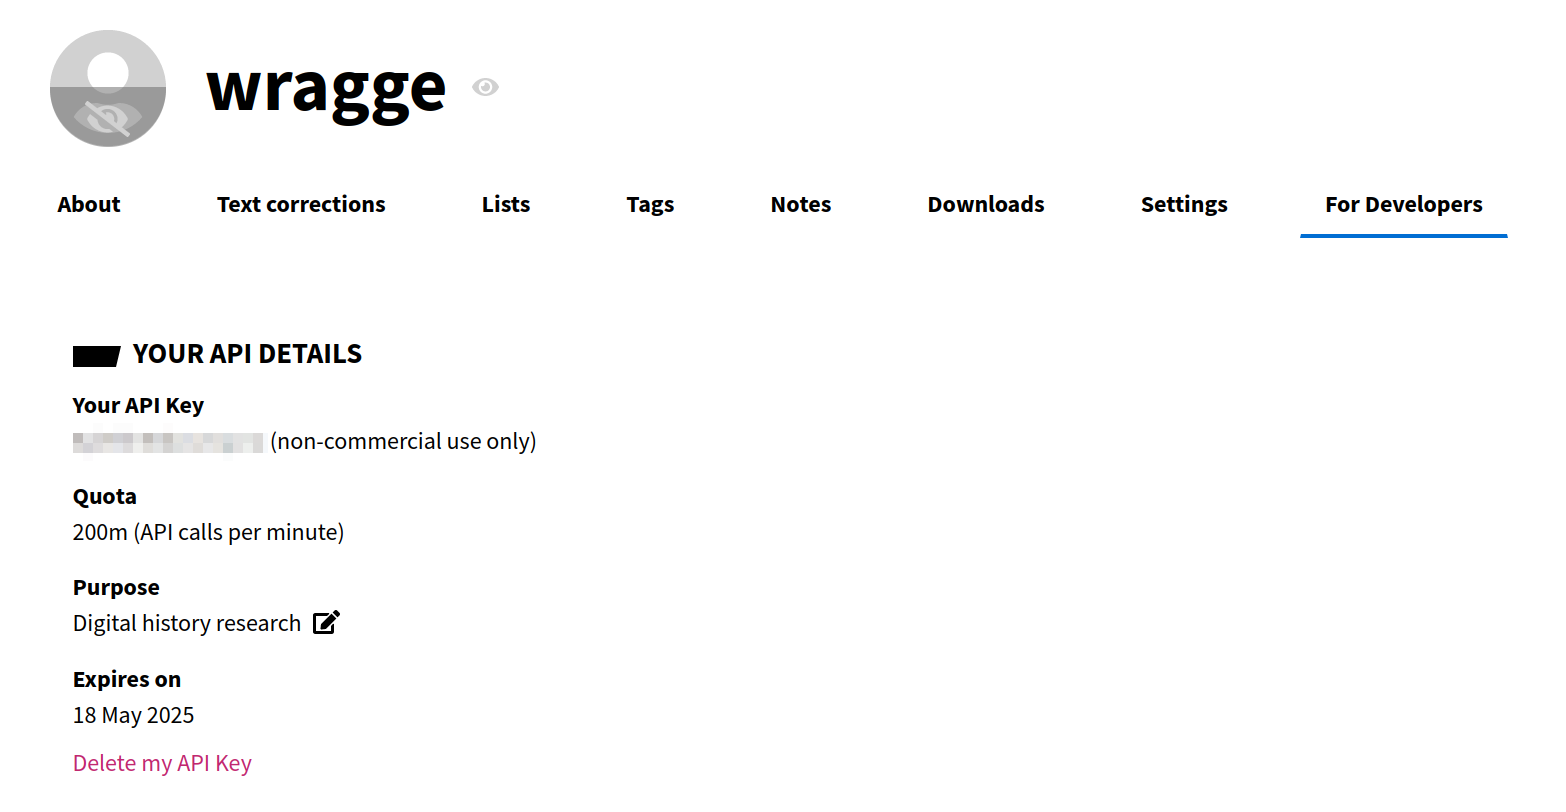
Fig. 27.1 Your API will be displayed in the ‘For developers’ tab of your user profile.#
Constructing your search#
The first step is constructing a search that will return relevant newspaper articles. This is harder than it seems. Yes, you can just plug keywords into Trove’s search interface and get back interesting looking results. But it’s important to keep in mind the differing needs of discovery versus analysis. Your aim here is not to find a few useful articles, but to construct a dataset containing all the articles returned by your search query. Everything. When you’re searching for individual articles you can usually just ignore the fact that there are millions of articles in your search results, as Trove’s relevance ranking pushes the most likely candidates to the top. But if you’re creating a dataset, you want to be as precise as possible to avoid including unwanted noise.
Relevance in bulk harvests
Unlike the web interface, when you harvest newspaper articles from the Trove API they’re ordered by their identifier, not their relevance. So you can’t just get the first few hundred articles and assume you’ve got the most important stuff. However, the API results do include a relevance score that you can use to filter the dataset after you’ve finished harvesting. This is discussed further below.
There are a few ways of making your search more precise:
de-fuzzify your results by controlling the precision of text searches
use proximity searches to specify the distance between search terms
apply facets to limit your results – in particular you might want to use:
Type to include newspapers (or gazettes) only
Category to specify the type of articles (do you really want to include advertisements?)
Place to specify the state in which articles were published
Word Count to limit to articles of a particular length
Date range to specify the date span (do you really want everything from 1803 to 2020?)
Once you’re happy with your search, copy the url in your browser’s location bar. You’ll need this url to run the Trove Newspaper & Gazette Harvester.
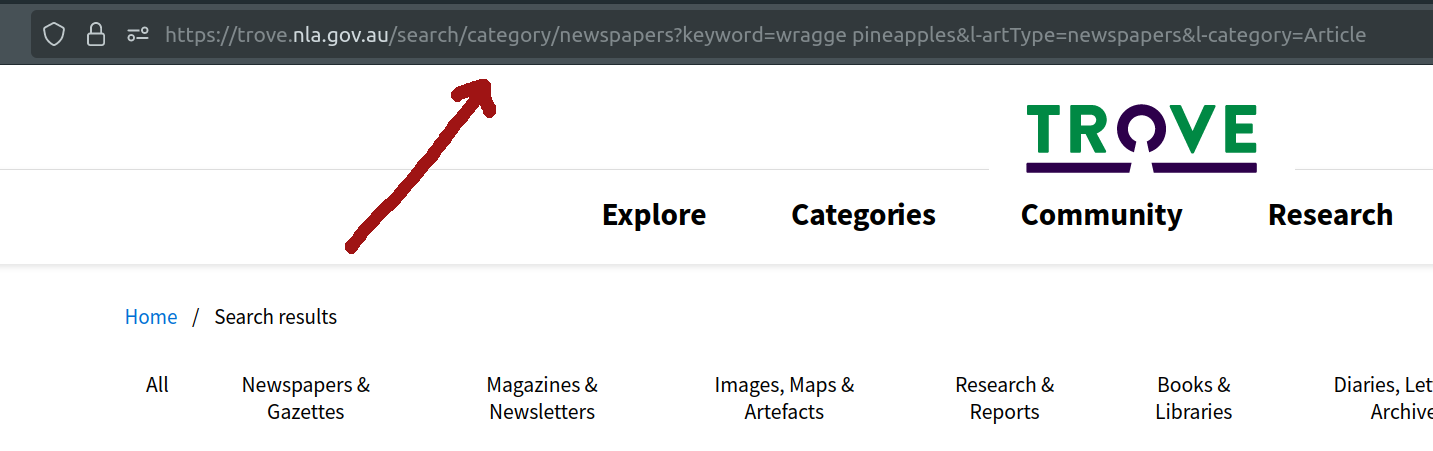
Fig. 27.2 Copy the url in your browser’s location bar.#
Trove Newspaper & Gazette Harvester#
The Trove Newspaper & Gazette Harvester is a tool that helps you harvest metadata, text, and images from a search in Trove’s digitised newspapers. You just give the harvester the url of a search and it will create a dataset containing hundreds, thousands, even millions of articles.
The Trove Newspaper & Gazette Harvester is available in a number of different forms according to your needs and skills. You can use it as:
a Python package embedded in your own data processing workflows
This tutorial uses the Jupyter Lab notebook available in the GLAM Workbench. You’ll need:
a Trove API key
the url of your search in the Trove web interface
Starting the notebook#
Go to Using the Trove Harvester as a Python package in the Trove newspaper harvester section of the GLAM Workbench.
This notebook, like all GLAM Workbench notebooks, needs to be run in a customised computing environment. The easiest way to do this is through BinderHub. BinderHub is a cloud-based service that gets a notebook up and running by reading its requirements from a code repository, and creating an environment with the necessary software. The GLAM Workbench is integrated with two BinderHub services:
ARDC Binder – based in Australia, requires login using university credentials
MyBinder – international, no login required
If you have a login at an Australian university or research agency, try the ARDC Binder service first. It’s a little more effort, but it’s usually faster and more reliable than the public MyBinder service which can have capacity issues.
The GLAM Workbench displays a preview of the notebook, with options to run it using either the ARDC Binder or MyBinder service.
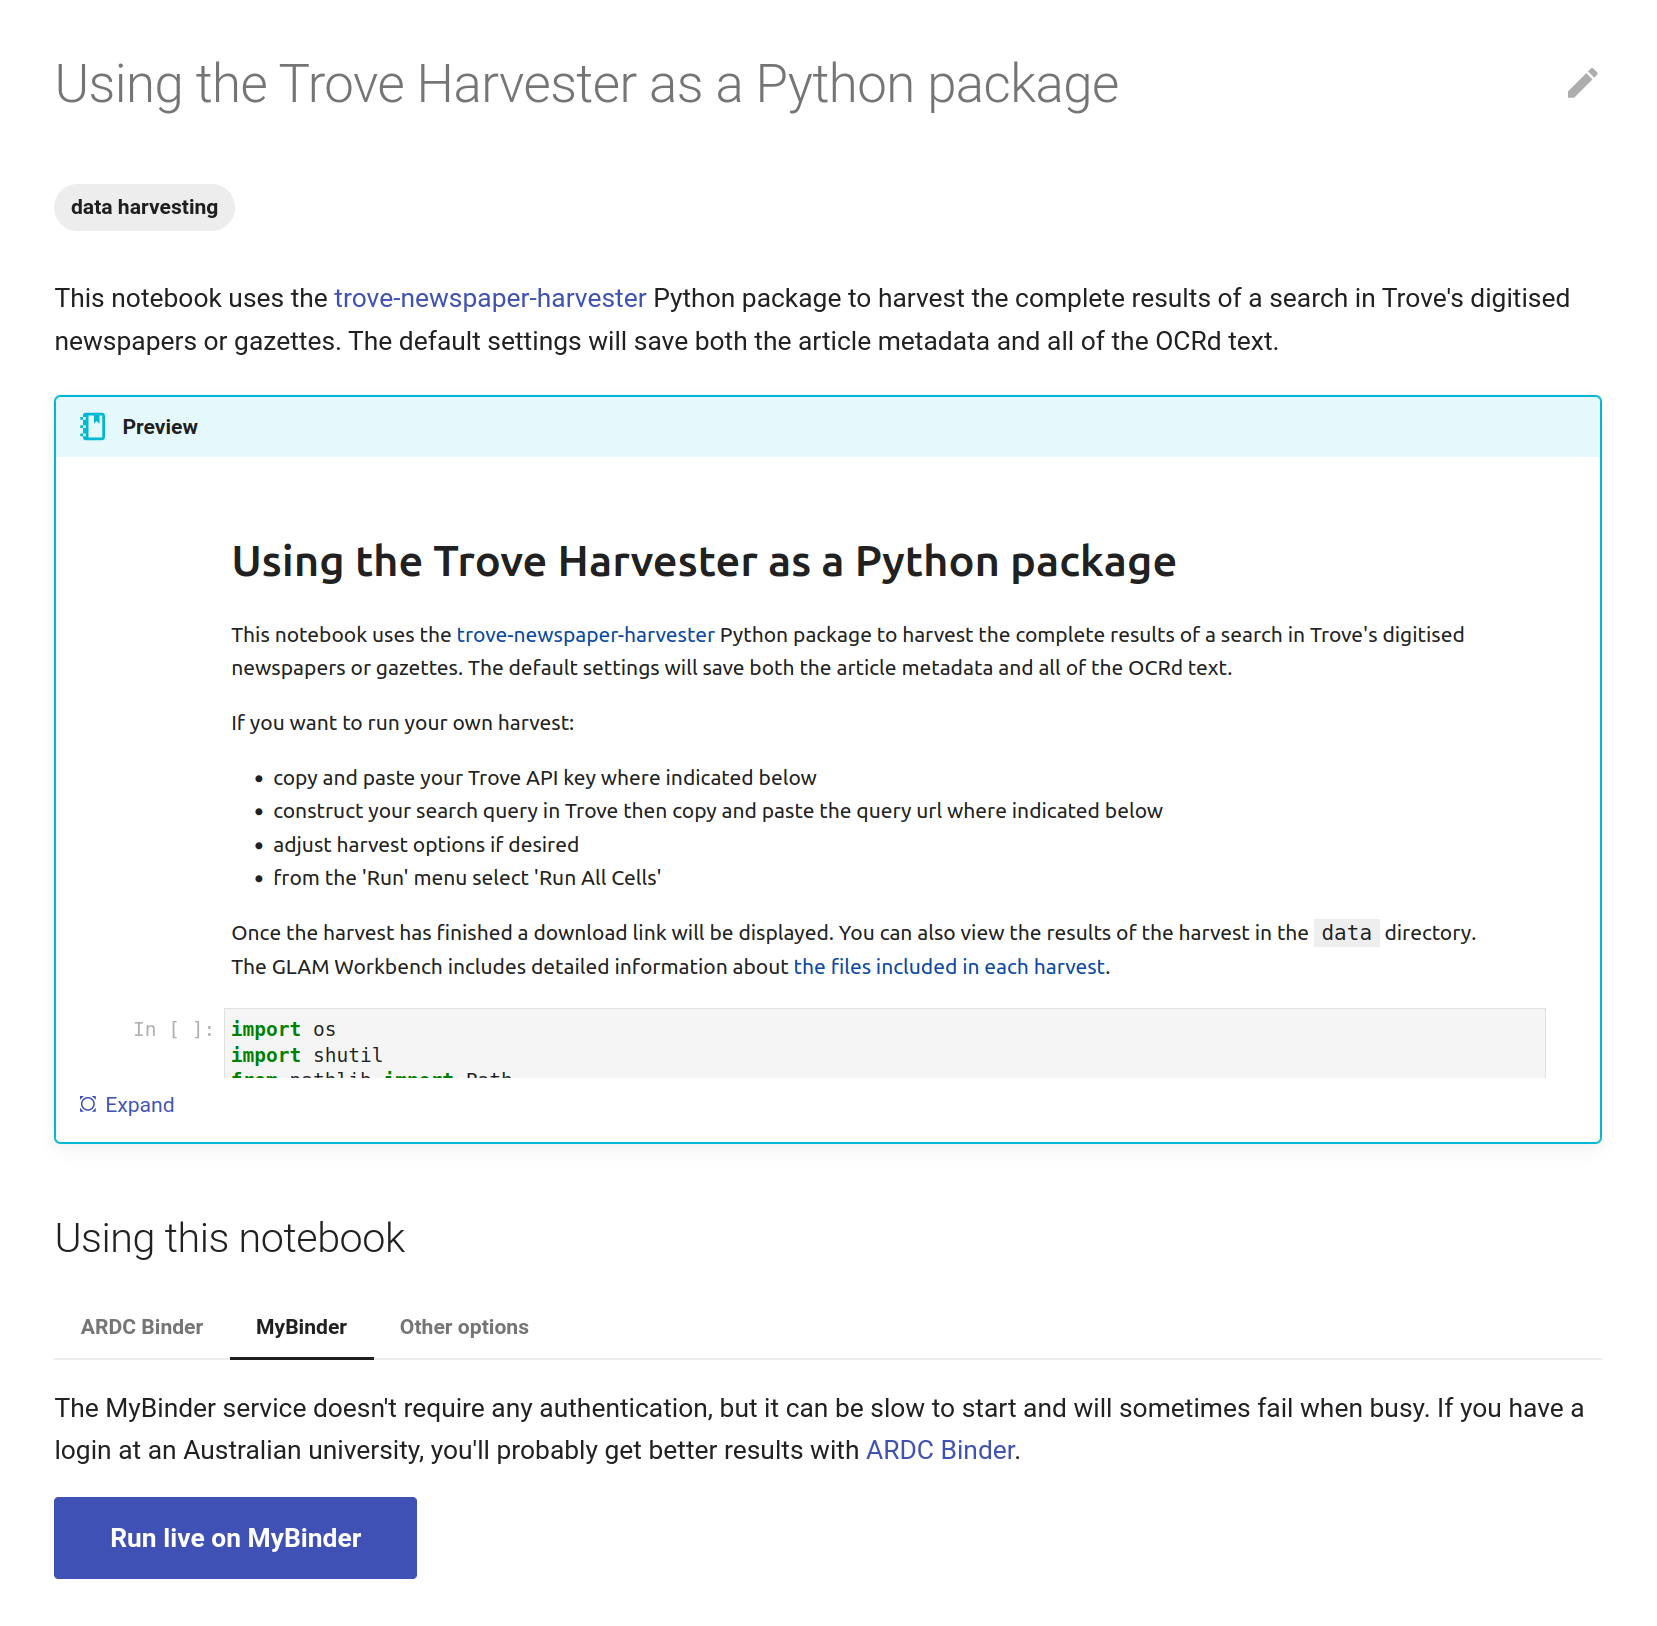
Fig. 27.3 The GLAM Workbench provides a number of ways you can run the notebook.#
Using ARDC Binder#
To use the ARDC Binder service, click on the ARDC Binder tab under the notebook preview. You should see a big, blue Run live on ARDC Binder button. Click on the button to launch the Binder service.
If this is the first time you’ve used the ARDC Binder service you’ll be asked to login using the Australian Access Federation (AAF).

Fig. 27.4 ARDC Binder will ask you to log in using AAF#
Click on the Sign in with AAF/Tuakiri button. You’ll be asked to select either AAF or Tuakiri – select AAF.
To sign in with AAF, select your institution from the list, then click the Continue to your organisation button.
Fig. 27.5 Select your institution from the AAF list#
You’ll be redirected to your insitution’s login screen. Log in using your usual credentials. Once you’ve logged in you’ll be redirected back to ARDC Binder and the notebook will start to load. You might have to wait a bit while a customised computing environment is prepared for you. If you see a message saying that things are taking a long time and there might be a problem, just ignore it. Eventually the notebook will load in the Jupyter Lab interface.
Using MyBinder#
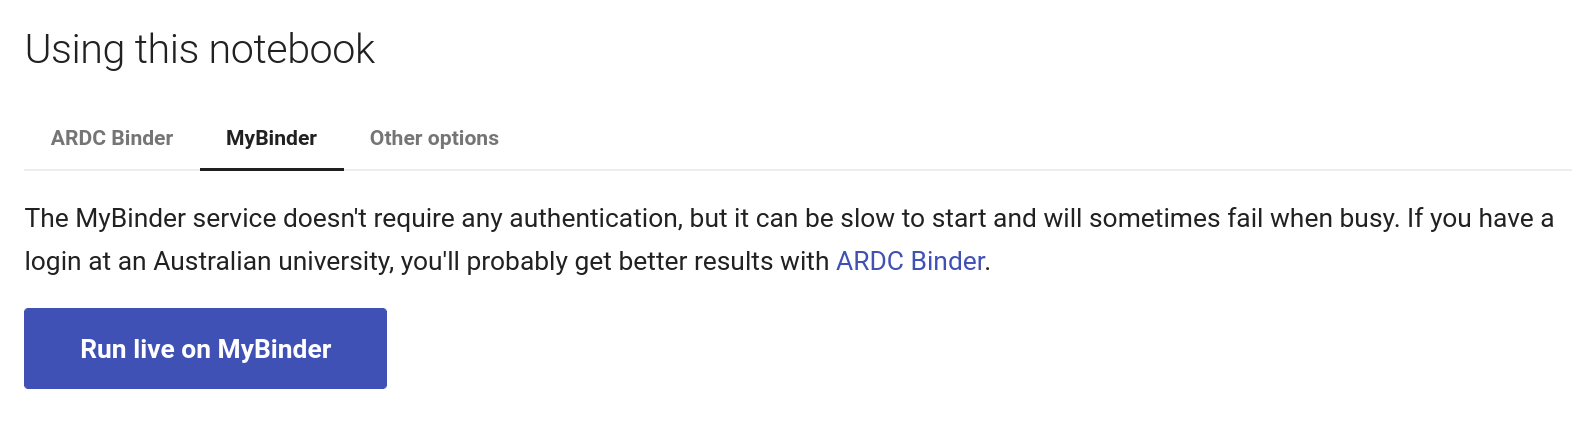
Fig. 27.6 Click on the MyBinder tab.#
To use the MyBinder service, click on the MyBinder tab under the notebook preview. You should see a big, blue Run live on MyBinder button. Click on the button to launch the Binder service. No login is required, so MyBinder immediately starts building a customised computing environment. This can take a while, but eventually the notebook should load in the Jupyter Lab interface.
Running your harvest#
No matter what service you use to run the notebook, the result will be the same – the notebook will open in the Jupyter Lab interface.
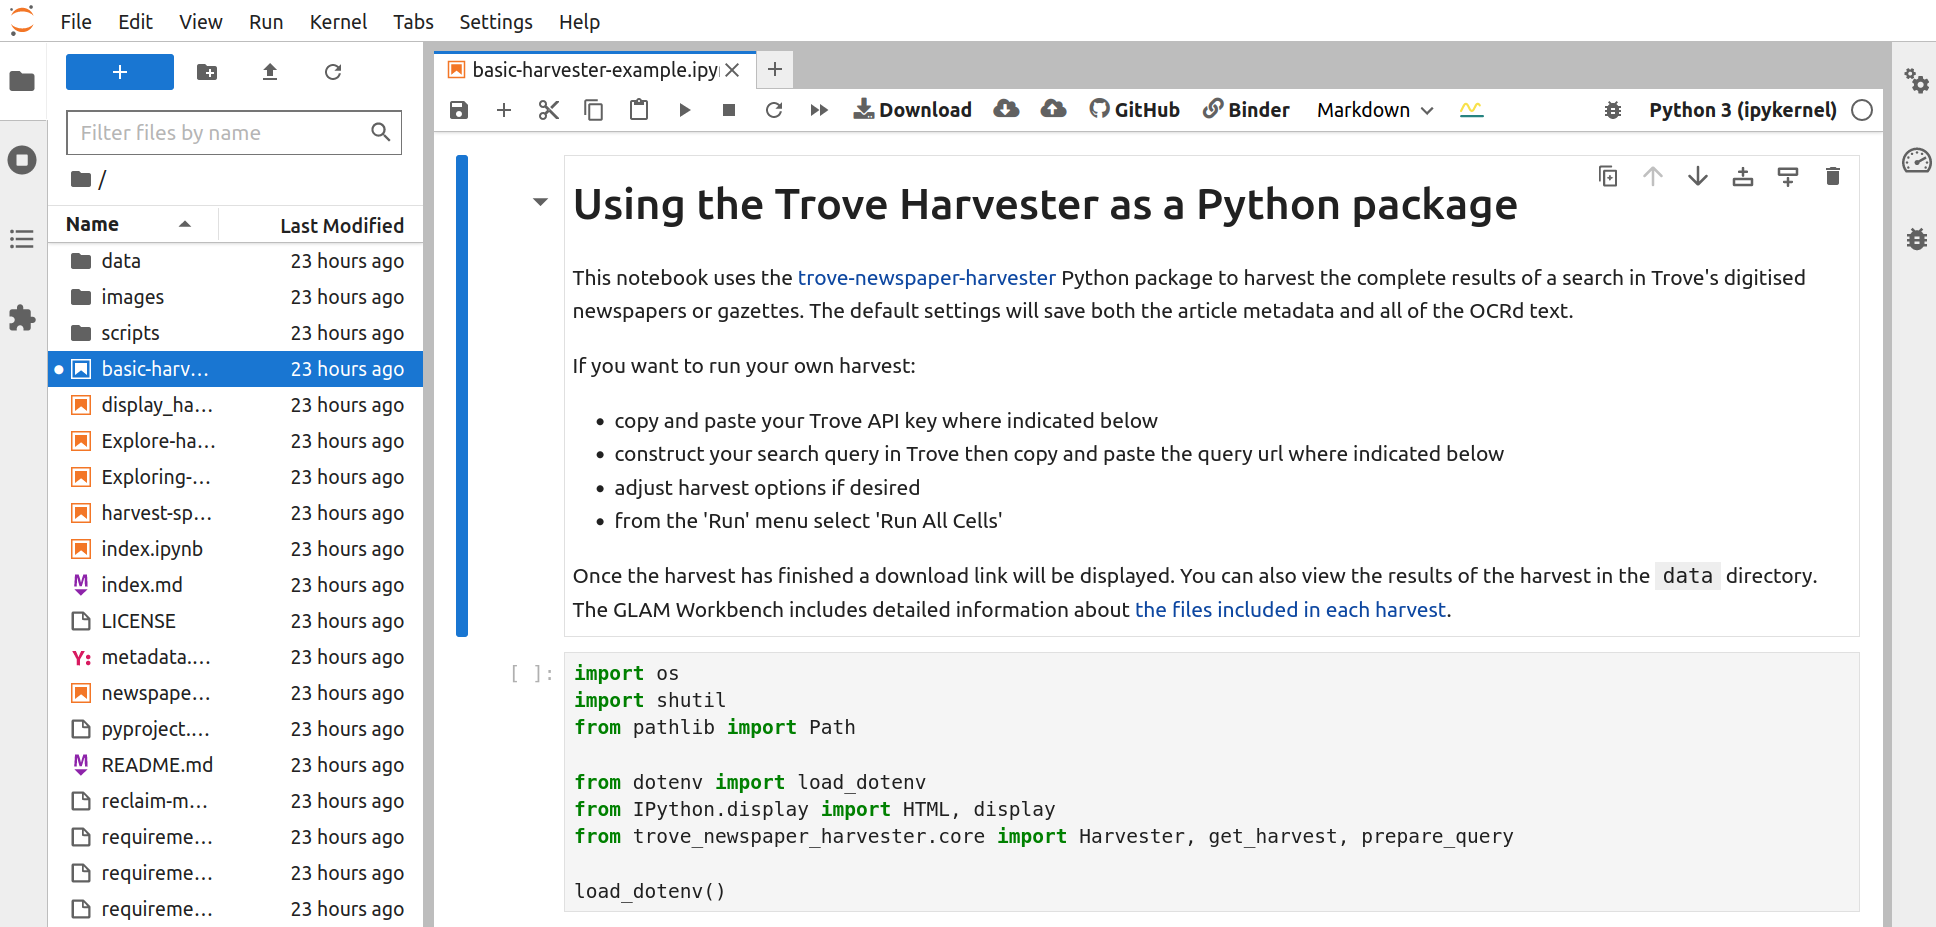
Fig. 27.7 The notebook running in Jupyter Lab.#
The Jupyter Lab interface has two main panes – a file browser is on the left, while the current notebook is displayed in the main, central pane.
Scroll down the notebook until you come to the section Set your Trove API key. Underneath the text is a code cell that sets the value of the API key to use with the harvester. Click on the code cell to activate it for editing (you’ll notice the border turns blue). Paste your API key where indicated between the double quotes.
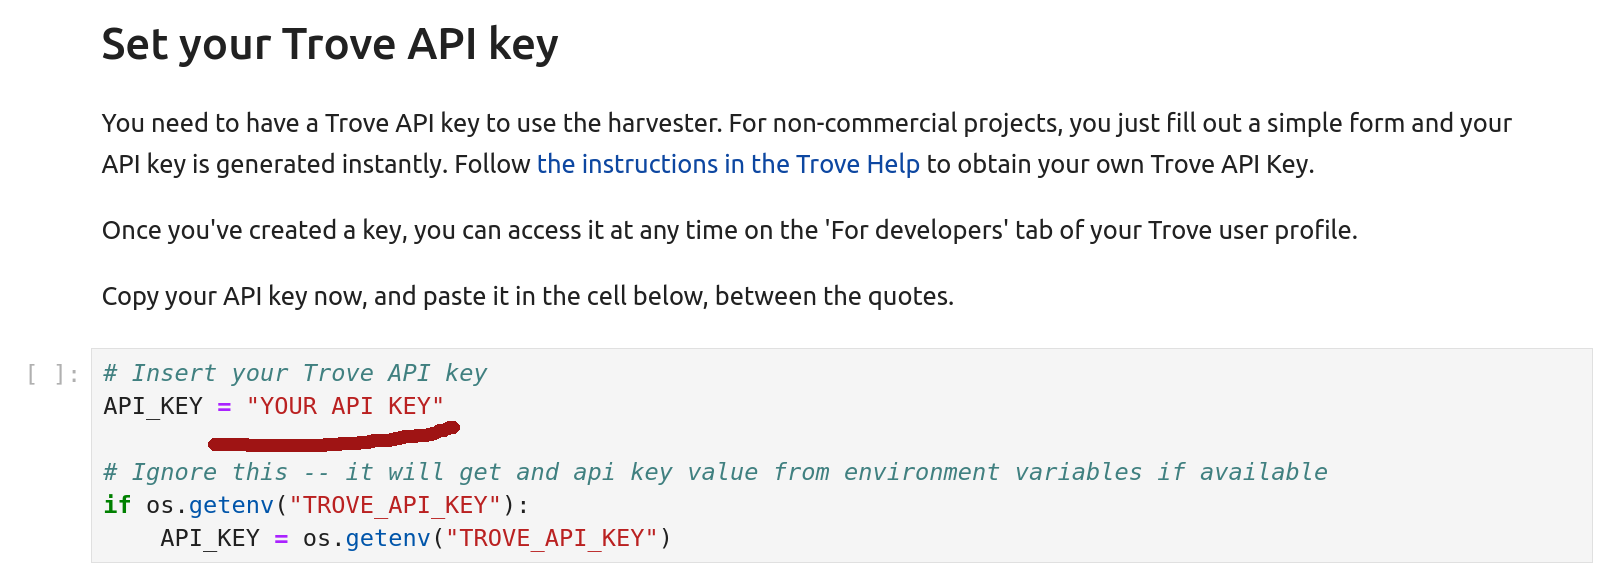
Fig. 27.8 Paste your API key between the quotes.#
Scroll further to the next section headed Set your search query. This is where you set the search url that the harvester will use to create your dataset. Click on the code cell and paste your url between the double quotes. The Newspaper & Gazette Harvester takes the url from your search and automatically translates it into a form the API understands.
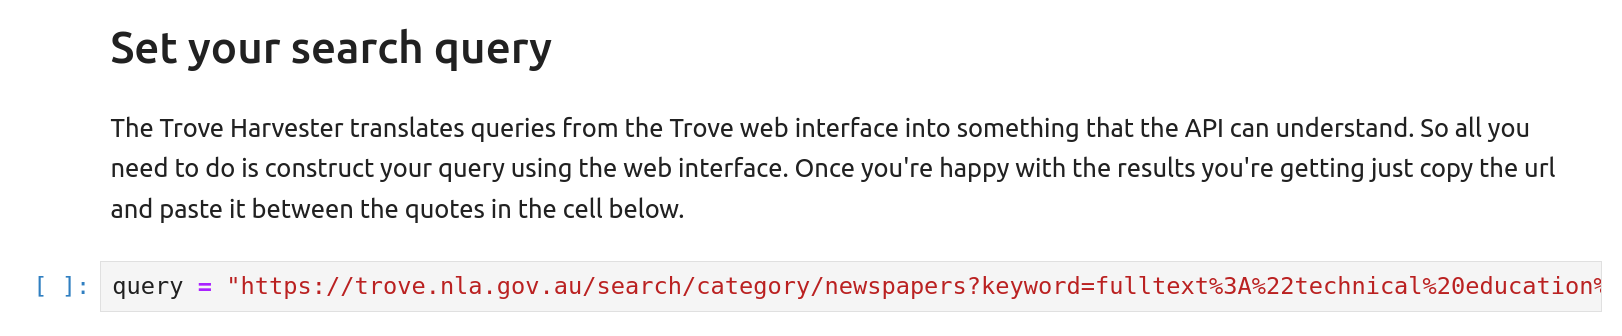
Fig. 27.9 Paste the url of your search between the quotes.#
You can now start your harvest! From the ‘Run’ menu select ‘Run All cells’.
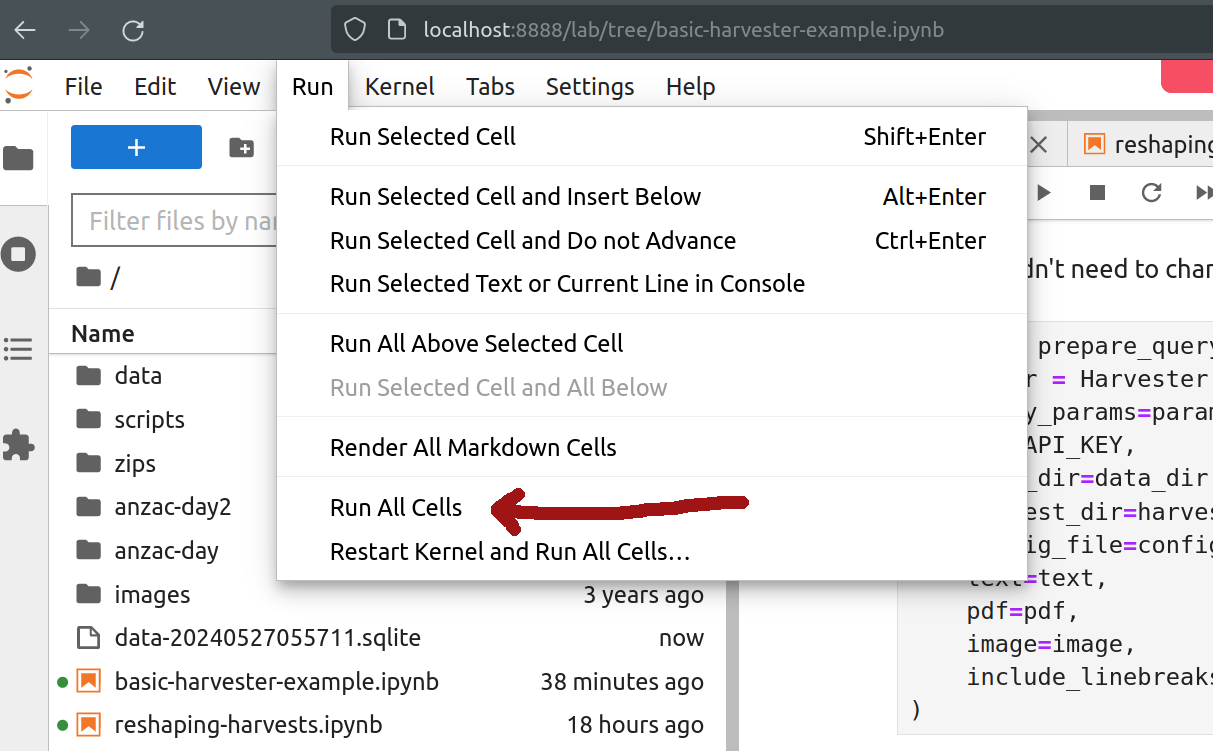
Fig. 27.10 Select Run > Run All Cells.#
To monitor the progress of your harvest scroll down until you see the cell containing harvester.harvest(). Beneath it you should see a progress bar that tells you how many articles have been saved.

Fig. 27.11 Monitor your harvest.#
Once the harvest is complete, the progress bar will turn green, and a link will appear to download all the harvested data as a zip file.
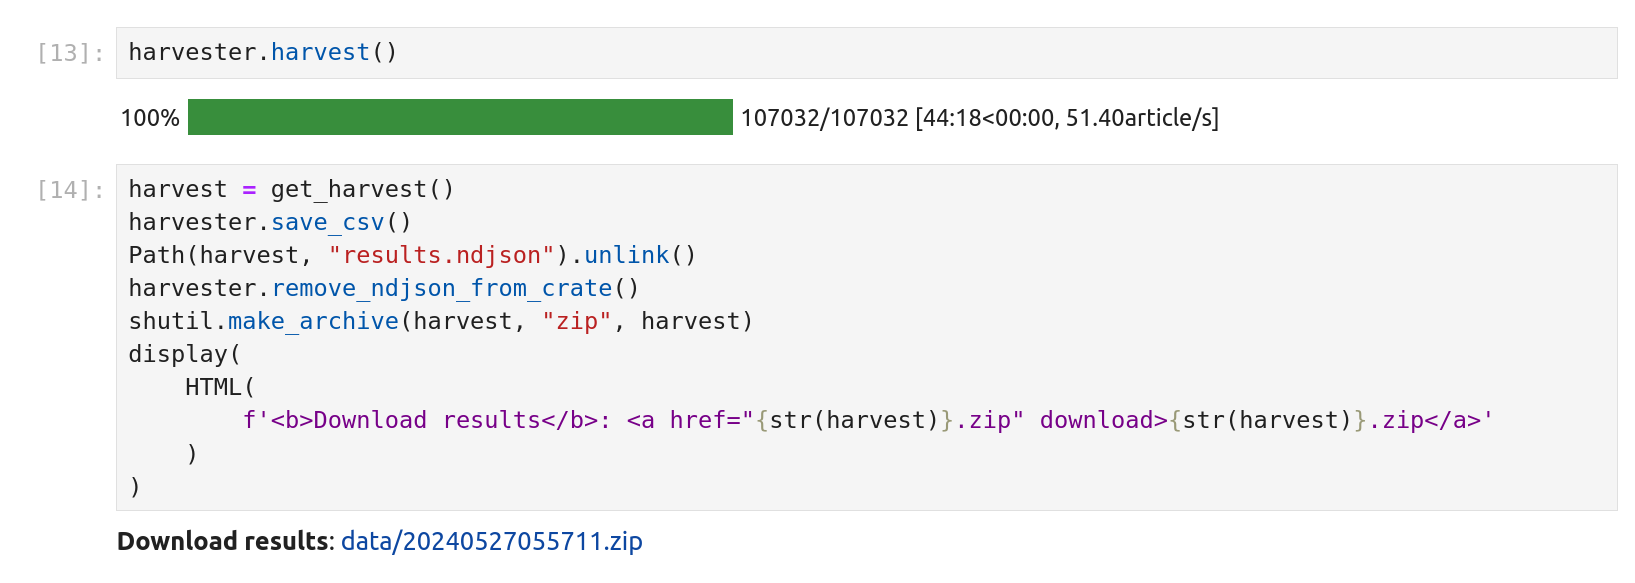
Fig. 27.12 The harvest is finished!#
Understanding your data#
STOP! Save your data now!
Before you do anything else, click on the ‘Download results’ link to download the harvested data as a zip file. Save it with you other research data and make sure it’s properly backed up. You might want to repeat this analysis sometime in the future, so it’s important to have access to the original data, especially given that Trove itself is changing all the time.
You can start exploring your harvested data in the Jupyter Lab interface. By default, the Harvester saves its outputs in the data directory. Double click on the data directory in the file browser to open it.
Individual harvests are named according to the date and time they were started. Within the data directory you should see a directory that starts with the current year, for example 20240527055711. Double click on the directory to open your harvest.
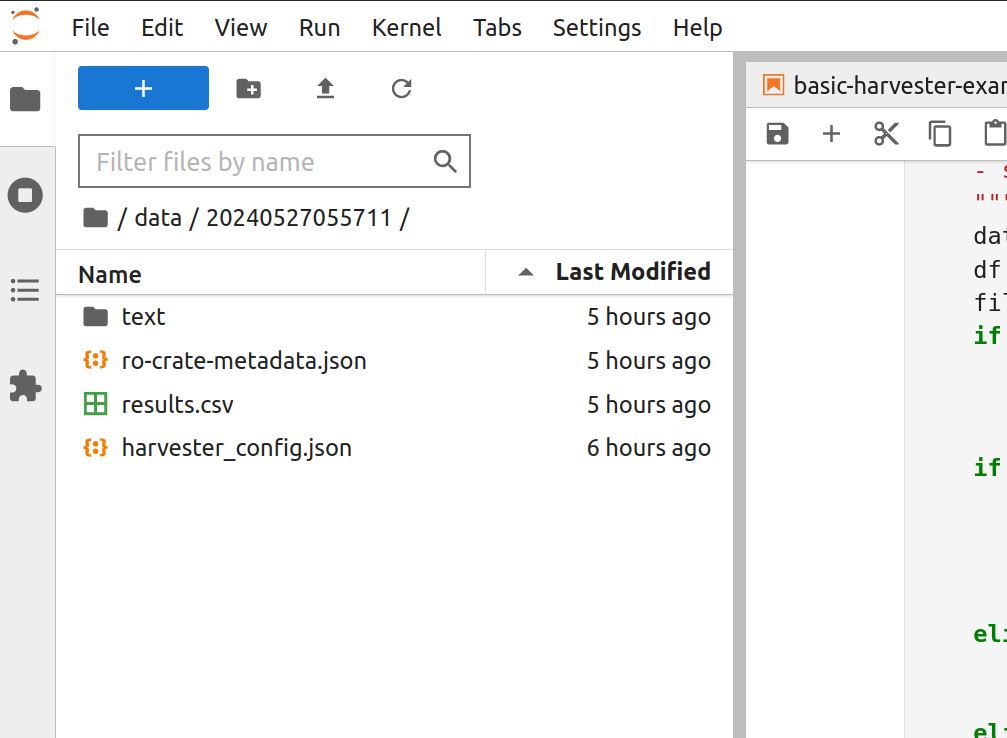
Fig. 27.13 Open the harvest directory to view the results.#
The harvest directory should contain three files and a directory.
harvester_config.jsona file that captures the parameters used to launch the harvestro-crate-metadata.jsona metadata file documenting the harvest in RO-Crate formatresults.csvcontains details of all the harvested articles in a plain text CSV (Comma Separated Values) file. You can open it with any spreadsheet program.texta directory containing the OCRd text of individual articles
You can double click on any of these to explore their contents in Jupyter Lab.
harvester_config.json#
This file captures the parameters used to create the harvest. This includes the search query parameters sent to the Trove API, as well as the Harvester’s own settings. Here’s an example:
{
    "query_params": {
        "q": "fulltext:\"technical education\"",
        "l-artType": "newspapers",
        "l-category": [
            "Article"
        ],
        "category": "newspaper",
        "encoding": "json",
        "reclevel": "full",
        "bulkHarvest": "true",
        "include": [
            "articleText"
        ]
    },
    "key": "[API KEY REDACTED]",
    "full_harvest_dir": "data/20240527055711",
    "maximum": null,
    "text": true,
    "pdf": false,
    "image": false,
    "include_linebreaks": false
}
You can use the harvester_config.json to re-run a harvest at some point in the future. This can be useful if you want to understand how changes to Trove’s newspaper corpus affect your results. To re-run a harvest, initialise the Harvester with the config_file parameter pointing to the location of an existing harvester_config.json.
ro-crate-metadata.json#
This file saves information about the context and results of the harvest in a standardised, machine-readable format. If you’ve ever come across a data file on your computer that you’ve created at some time in the past, but have no memory of how or why you created it, you’ll appreciate the importance of capturing the context in which datasets are created at the point of creation. The Harvester does this automatically to save you from future confusion and embed good data management practice. The file is formatted according to the RO-Crate specification for describing research objects. It includes information such as the date of the harvest and the version of the Harvester software, as well as the number of articles saved. Here’s a (slightly truncated) example:
{
    "@context": "https://w3id.org/ro/crate/1.1/context",
    "@graph": [
        {
            "@id": "./",
            "@type": "Dataset",
            "datePublished": "2024-05-27T05:57:12+00:00",
            "description": "This dataset of digitised newspaper articles from Trove was created using the Trove Newspaper Harvester. Details of the search query used to generate this dataset can be found in the harvester_config.json file.",
            "hasPart": [
                {
                    "@id": "harvester_config.json"
                },
                {
                    "@id": "text"
                },
                {
                    "@id": "results.csv"
                }
            ],
            "mainEntity": {
                "@id": "#harvester_run"
            },
            "name": "Dataset of digitised newspaper articles harvested from Trove on 27 May 2024"
        },
        {
            "@id": "ro-crate-metadata.json",
            "@type": "CreativeWork",
            "about": {
                "@id": "./"
            },
            "conformsTo": {
                "@id": "https://w3id.org/ro/crate/1.1"
            },
            "license": {
                "@id": "https://creativecommons.org/publicdomain/zero/1.0/"
            }
        },
        {
            "@id": "harvester_config.json",
            "@type": "File",
            "encodingFormat": "application/json",
            "name": "Trove Newspaper Harvester configuration file"
        },
        {
            "@id": "text",
            "@type": [
                "File",
                "Dataset"
            ],
            "dateCreated": "2024-05-27T16:41:30.491764+10:00",
            "description": "There is one text file per article. The file titles include basic article metadata \u2013 the date of the article, the id number of the newspaper, and the id number of the article.",
            "license": {
                "@id": "http://rightsstatements.org/vocab/CNE/1.0/"
            },
            "name": "Text files harvested from articles",
            "size": 107032
        },
        {
            "@id": "results.csv",
            "@type": [
                "File",
                "Dataset"
            ],
            "contentSize": 48017711,
            "dateCreated": "2024-05-27T16:41:33.772582+10:00",
            "encodingFormat": "text/csv",
            "license": {
                "@id": "http://rightsstatements.org/vocab/NKC/1.0/"
            },
            "name": "Metadata of harvested articles in CSV format",
            "size": 107032
        },
        {
            "@id": "#harvester_run",
            "@type": "CreateAction",
            "actionStatus": {
                "@id": "http://schema.org/CompletedActionStatus"
            },
            "endDate": "2024-05-27T16:41:30.491764+10:00",
            "instrument": "https://github.com/wragge/trove-newspaper-harvester",
            "name": "Run of harvester",
            "object": "harvester_config.json",
            "result": [
                {
                    "@id": "text"
                },
                {
                    "@id": "results.csv"
                }
            ],
            "startDate": "2024-05-27T15:57:12.306629+10:00"
        },
        {
            "@id": "https://github.com/wragge/trove-newspaper-harvester",
            "@type": "SoftwareApplication",
            "description": "The Trove Newspaper (& Gazette) Harvester makes it easy to download large quantities of digitised articles from Trove\u2019s newspapers and gazettes.",
            "documentation": "https://wragge.github.io/trove-newspaper-harvester/",
            "name": "Trove Newspaper and Gazette Harvester",
            "softwareVersion": "0.7.2",
            "url": "https://github.com/wragge/trove-newspaper-harvester"
        }
    ]
}
results.csv#
The file saves metadata from all the articles in the results set. It’s formatted as a CSV (Comma Separated Values) file that can be opened in any spreadsheet program (though beware of Excel’s penchant for mangling dates). The dataset contains the following columns:
column |
description |
|---|---|
|
Trove’s unique identifier for the article |
|
the title of the article |
|
date in ISO format, YYYY-MM-DD |
|
page number (of course), but might also indicate the page is part of a supplement or special section |
|
Trove’s unique identifier for the newspaper or gazette title (this can be used to retrieve more information or build a link to the web interface) |
|
the name of the newspaper (or gazette) |
|
one of ‘Article’, ‘Advertising’, ‘Detailed lists, results, guides’, ‘Family Notices’, or ‘Literature’ |
|
number of words in the article |
|
is it illustrated (values are y or n) |
|
edition of newspaper (rarely used) |
|
section of newspaper (rarely used) |
|
section of newspaper (rarely used) |
|
the persistent url for the article |
|
the persistent url of the page on which the article is published |
|
short text sample |
|
search relevance score of this result |
|
some articles that are still being processed will have the status “coming soon” and might be missing other fields |
|
number of text corrections |
|
date of last correction |
|
number of attached tags |
|
number of attached comments |
|
number of lists this article is included in |
|
path to text file (if harvested) |
|
path to PDF file (if harvested) |
|
path to image file(s) (if harvested) |
text#
The text directory contains the OCRd text of individual articles – there’s one file for each article in the results set. These are just plain text files, stripped on any HTML. The files include some basic metadata in their file titles – the date of the article, the id number of the newspaper, and the id number of the article. So, for example, the filename 19460104-1002-206680758.txt tells you:
19460104– the article was published on 4 January 1946 (YYYYMMDD)1002– the article was published in The Tribune206680758– the article’s unique identifier
You can use the newspaper and article ids to create direct links into Trove:
to a newspaper or gazette
https://trove.nla.gov.au/newspaper/title/[newspaper id]to an article
http://nla.gov.au/nla.news-article[article id]
Reshaping your results#
The Trove Newspaper & Gazette Harvester saves metadata and content from all the newspaper articles in a set of search results. You could easily end up with a dataset containing thousands (or even millions) of articles published across two centuries of Australian history. This opens up possibilities for fine-grained analysis – tracking language, events, and publication patterns back to a specific article in a specific newspaper issue. But you might also want to observe changes at a larger scale, comparing years, decades, or newspapers rather than individual articles. Some text analysis tools also work best with aggregated collections, or corpora, rather than thousands of tiny text files. As a result, you might want to reshape your harvested dataset, creating subsets of articles for analysis.
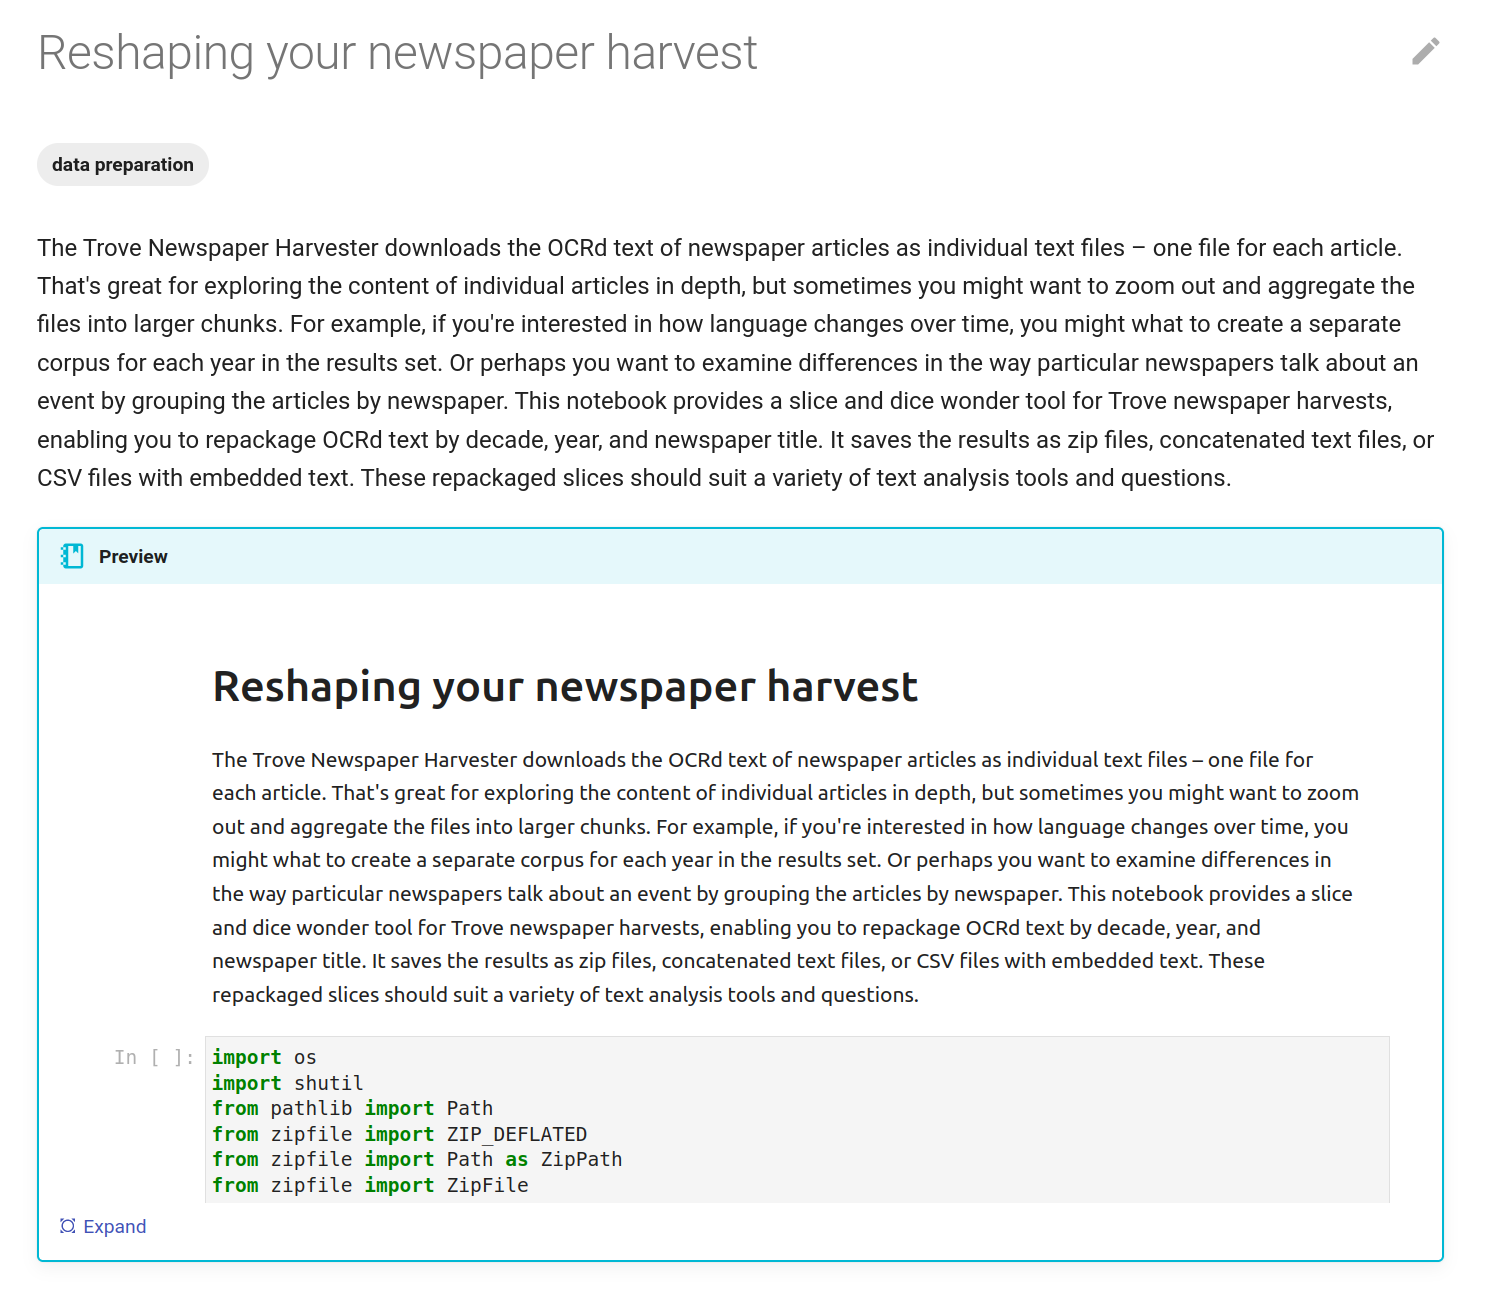
Fig. 27.14 The Reshaping your newspaper harvest notebook in the GLAM Workbench.#
The Reshaping your newspaper harvest notebook in the Trove Newspaper & Gazette Harvester section of the GLAM Workbench helps you slice your dataset in a number of different ways, creating subsets to suit particular research questions or preferred tools. You can slice the dataset:
by year or decade
by newspaper
by newspaper and year
In addition, you can filter the newspapers to include only the ‘top’ titles – measured by either the number of articles in the dataset, or the total number of words in articles.
You can also filter the dataset using the relevance score generated by Trove’s search index. For example, you can exclude articles with relevance scores in the bottom 50% across the entire dataset.
These subsets can be saved in different formats to meet the needs of a variety of tools:
as zip files containing individual text files (one zip file for each slice)
as text files containing the concatenated text of all the articles in the subset (one text file for each slice)
as CSV files containing both the metadata and OCRd text for each article in the subset
You might need to experiment with different ways of reshaping your harvest as you develop your research questions and become familar with the capabilities of different text analysis tools.
Running the notebook#
If the BinderHub session you used to create your harvest is still running, you can start the ‘Reshaping your newspaper harvest’ notebook by looking for the file reshaping-harvests.ipynb in the file browser and double clicking it.
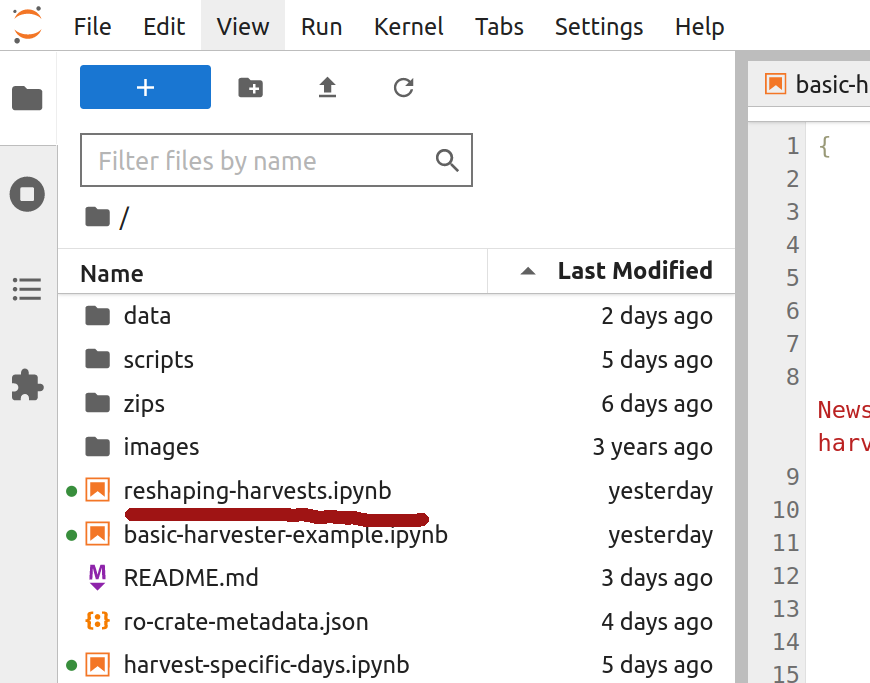
Fig. 27.15 Double click on reshaping-harvests.ipynb to start the notebook.#
If you’re using the ARDC BinderHub service, your session might still be running even if you don’t have it open in your browser. Go to the Control Hub. If it says ‘Your server is running’, click on the Go to my server button to load it in your browser, then double click on the reshaping-harvests.ipynb file.
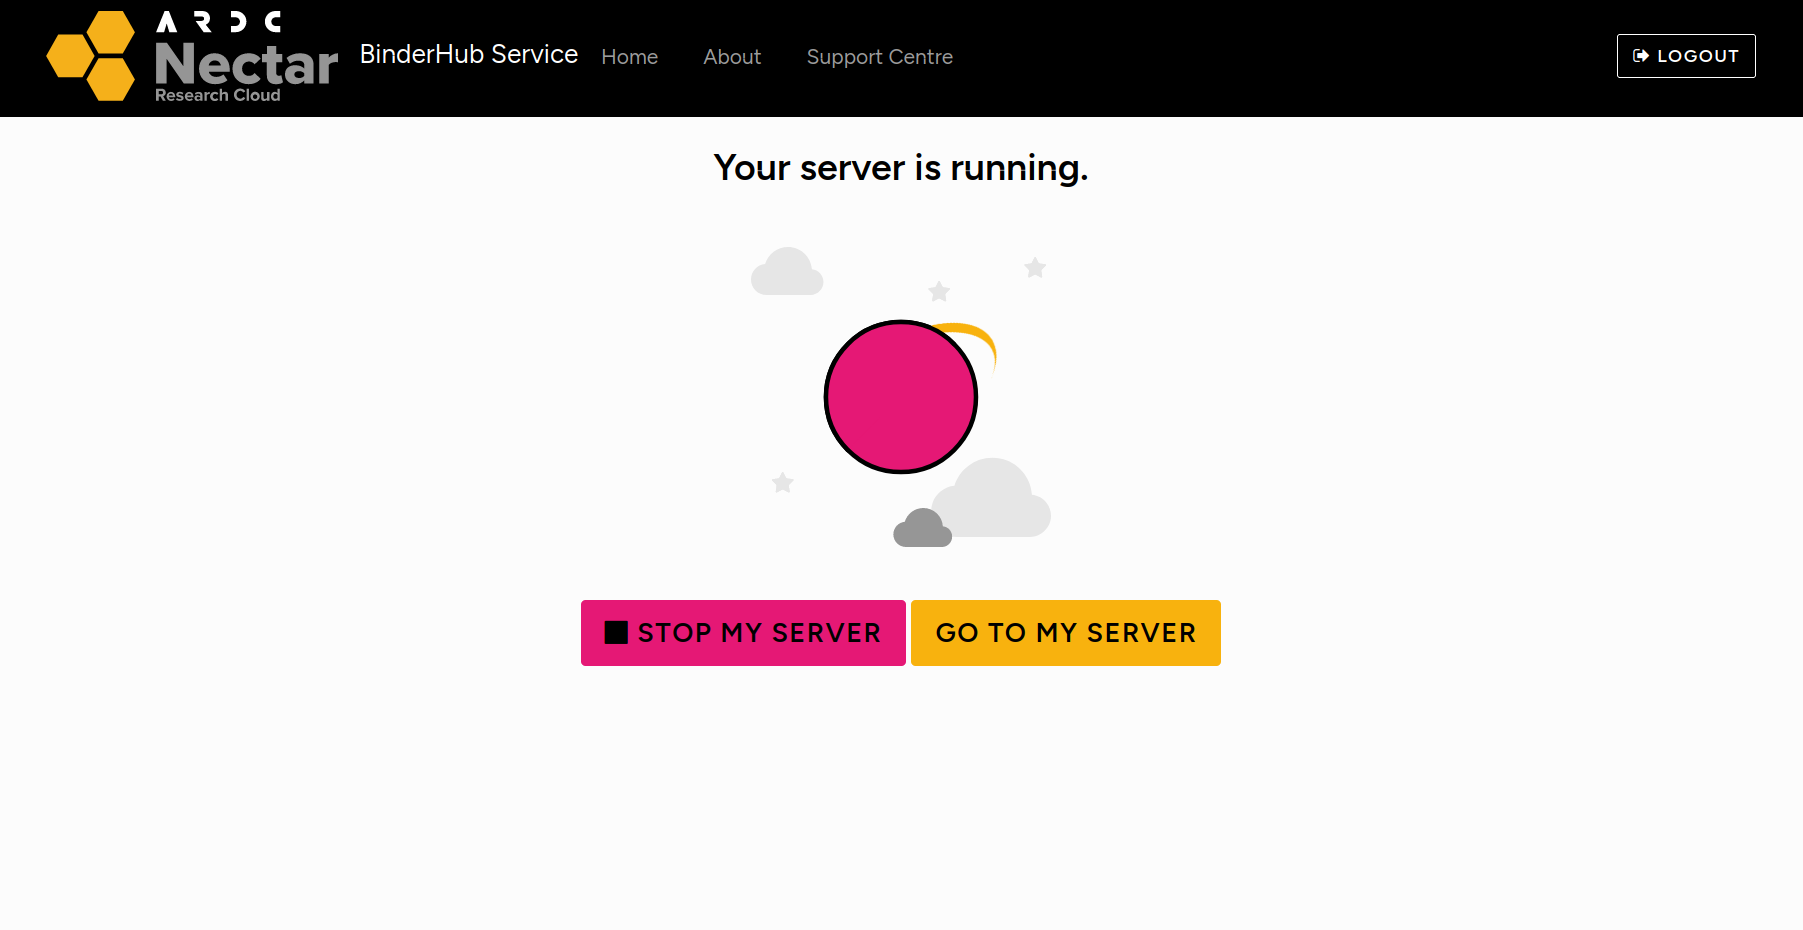
Fig. 27.16 If your server is running click on the Go to my server button.#
If the server isn’t running, or if you’re using the MyBinder service, go to the notebook in the GLAM Workbench and select either the ARDC Binder or MyBinder option as described above.
Loading your data#
If the Binder session you used to harvest your data is still running, your results will already be available in the data directory.
However, if you’ve launched a new Binder session, you’ll have to upload your harvested data. Double click the zips directory in the Jupyter Lab file browser to open it. Then click on the upload icon and select the zip file containing your harvested results. The notebook will unzip the file and load the contents into the data directory.
Creating a HarvestSlicer#
Click on the first cell in the notebook to activate it, then press your keyboard’s SHIFT and ENTER keys together. The SHIFT+ENTER key combination runs the currently selected cell in a Jupyter notebook. It also shifts the focus to the next cell, activating it. This means you can work your way down a notebook by hitting SHIFT+ENTER on each cell in turn. Running each cell in this way will make the code inside the cells available further down the notebook.
Continue hitting SHIFT+ENTER until you reach the section headed ‘Using the Harvest Slicer’.
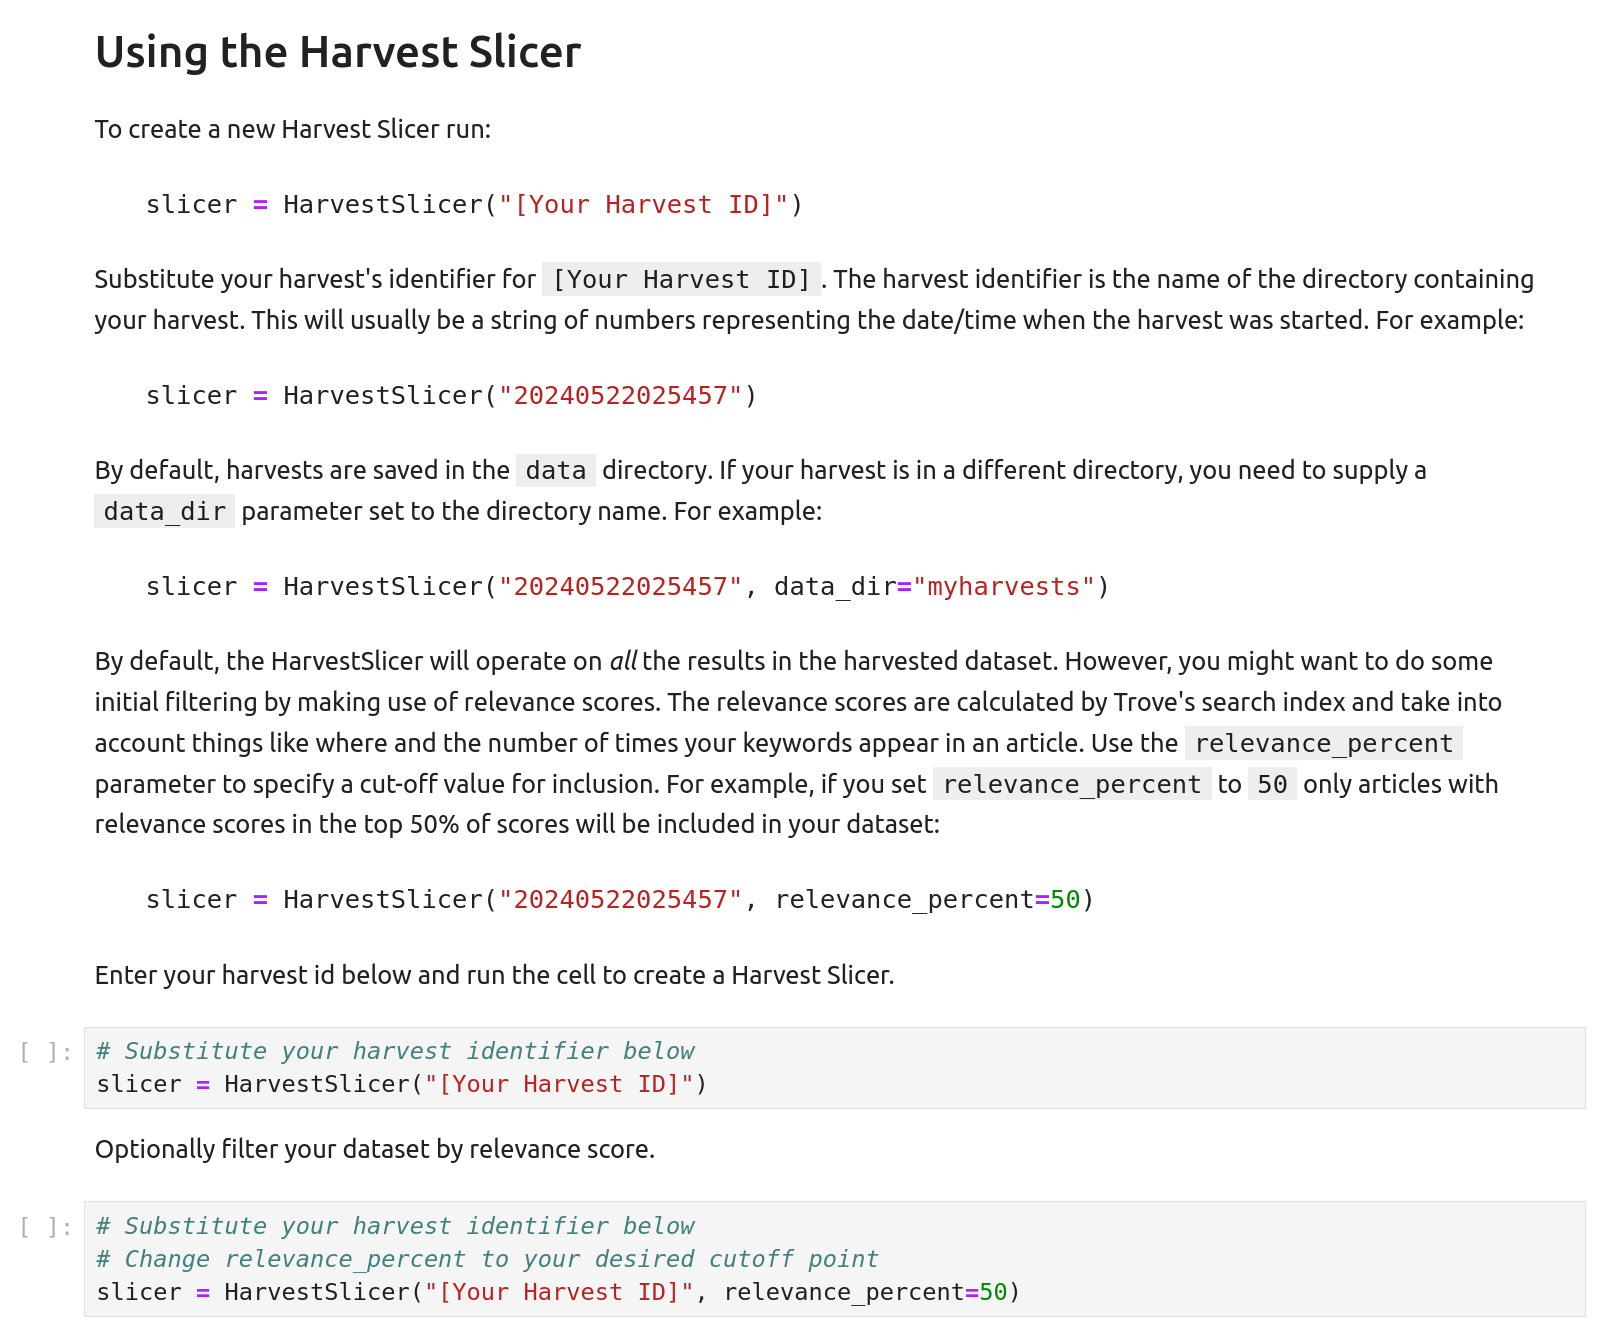
Fig. 27.17 Look for the ‘Using the Harvest Slicer’ section.#
The first step in reshaping your results is to create a HarvestSlicer. To do this you’ll need to know the name of the directory containing your results. You can find the name by looking in the data directory – it’ll be a series of numbers representing the date and time when the harvest was started, for example 20240527055711.
When you create the HarvestSlicer you can choose whether you want to filter your results by their relevance scores. This can make large harvests more focussed and manageable, reducing the amount of data you have to move around. This is useful as some analysis tools will have limits on the amount of data they can process. However, there’s no documentation on the way Trove calculates its relevance scores, so there’s always the risk you might unknowingly lose valuable data points. You might want to experiment with relevance score filtering to see how it changes your analysis.
Look for the two code cells under ‘Using the Harvest Slicer’. The first creates a HarvestSlicer without any relevance filtering.
Fig. 27.18 This code cell creates a HarvestSlicer.#
The second creates a HarvestSlicer with the relevance_percent parameter set to 50. This means results with relevance scores in the bottom 50% will be excluded.
Fig. 27.19 This code cell creates a HarvestSlicer and filters results by their relevance scores.#
Decide whether you want to use relevance filtering or not and click on the corresponding cell. Paste the name of the directory containing your harvest between the double quotes where the code says "[Your Harvest ID]". If you’re using relevance filtering you can change the relevance_percent value from 50 to something else.
Hit SHIFT+ENTER to run the code cell and create the HarvestSlicer.
Slicing by year#
The ‘Reshaping your newspaper harvest’ notebook includes a range of examples, demonstrating how you can slice your results set by year, decade, and newspaper.
To slice by year, scroll down the notebook until you reach the ‘Slicing by decade or year’ section.
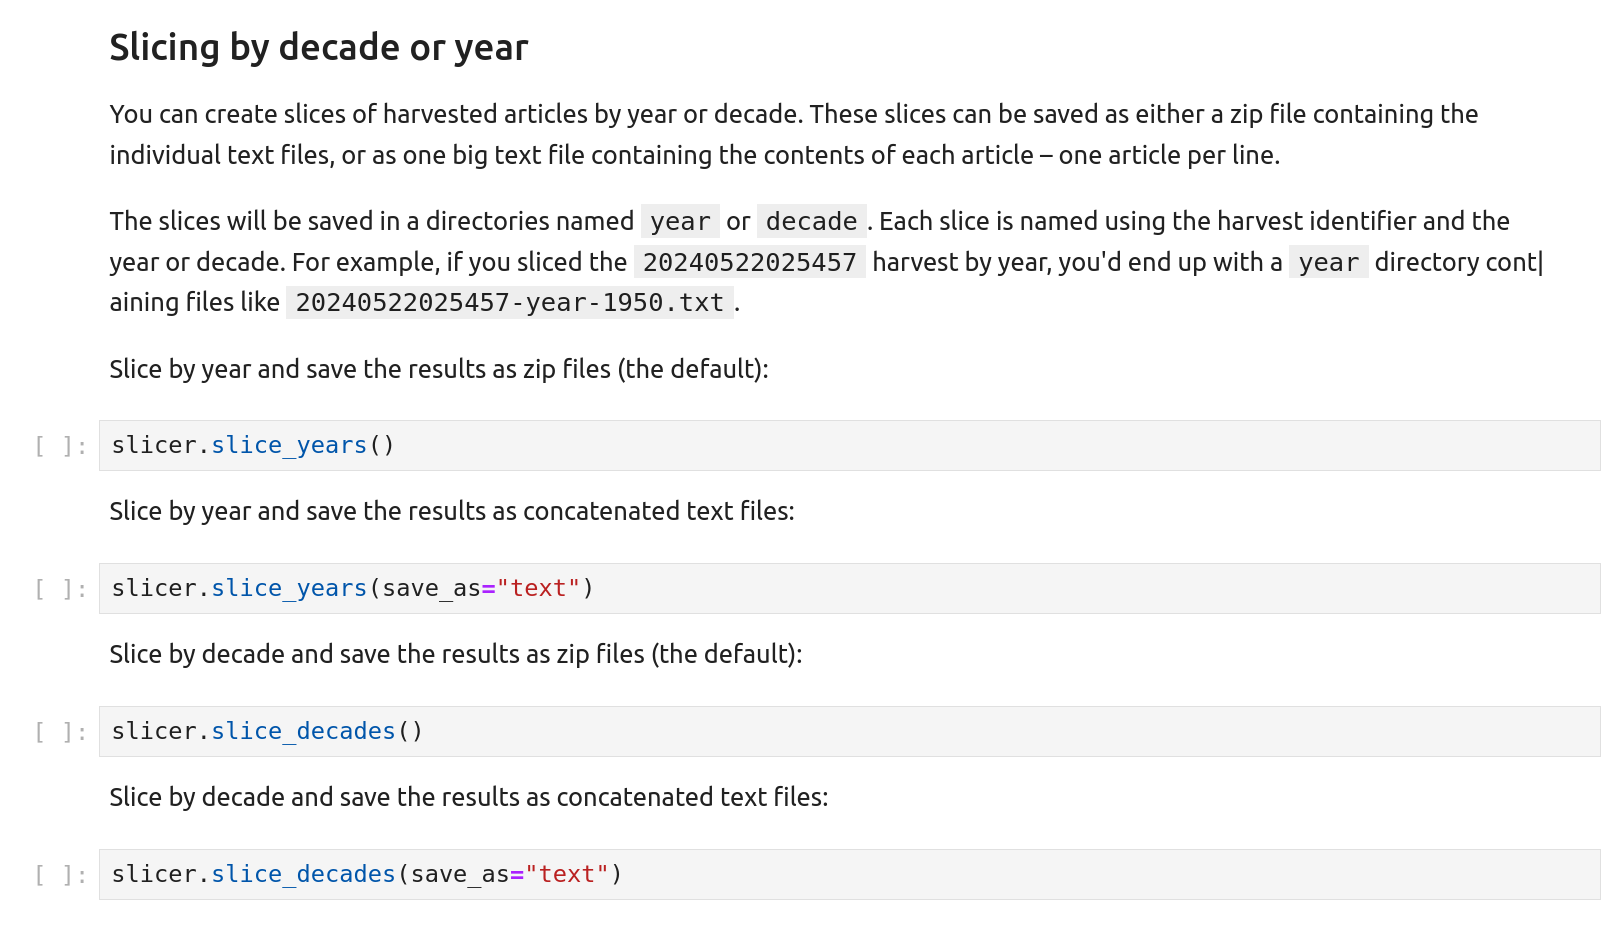
Fig. 27.20 Slice your harvest by year or decade.#
You can save your slices as zip files or concatenated text files, with zip files the default. The notebook includes two code cells that slice results by year. The first uses the default settings to save the slices as zip files.
Fig. 27.21 Slice your harvest by year saving the slices as zip files.#
The second cell uses the save_as parameter to save the slices as text.
Fig. 27.22 Slice your harvest by year saving the slices as concatenated text files.#
Both zip and text files will work with ATAP’s text analysis tool, so click on either of the cells and (you guessed it!) hit SHIFT+ENTER to start slicing!
The slices will be saved in your harvest directory. Slices by year will be saved in a sub-directory named year, slices by decade in decade, slices by newspaper in title, and slices by year and newspaper in year-title. If you’ve filtered the results by relevance, the filter settings will be appended to the directory name, for example year-relevance-50.
Individual slices will be named using the harvest identifier, slice type, and slice value, for example 20240527055711-year-1950.zip.
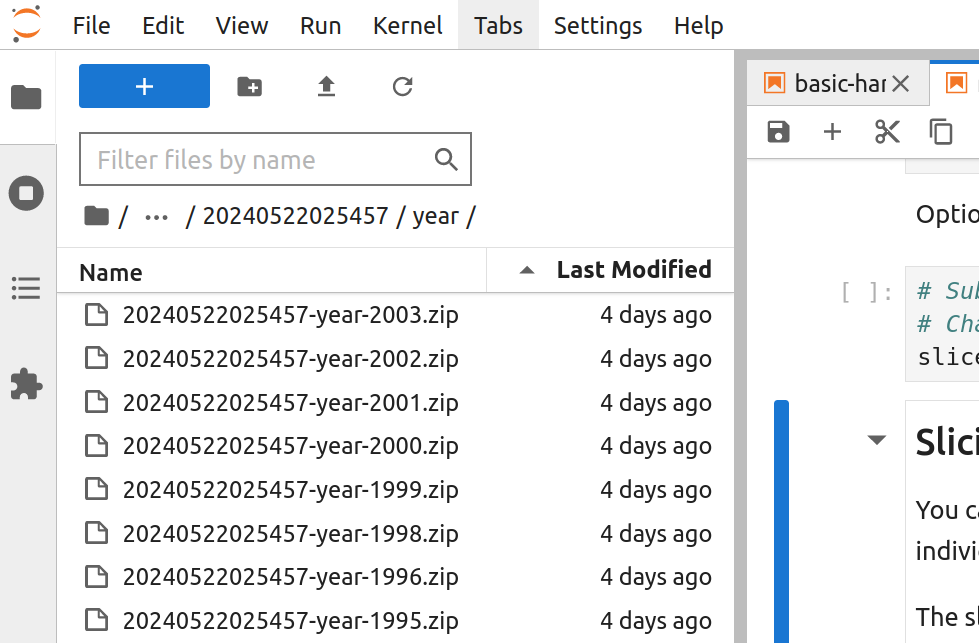
Fig. 27.23 Slices by year will be saved in the year directory.#
Depending on the questions you want to pursue, you might choose to download either selected slices or the complete set. To download an individual file, right click on it in the file browser and select ‘Download’.
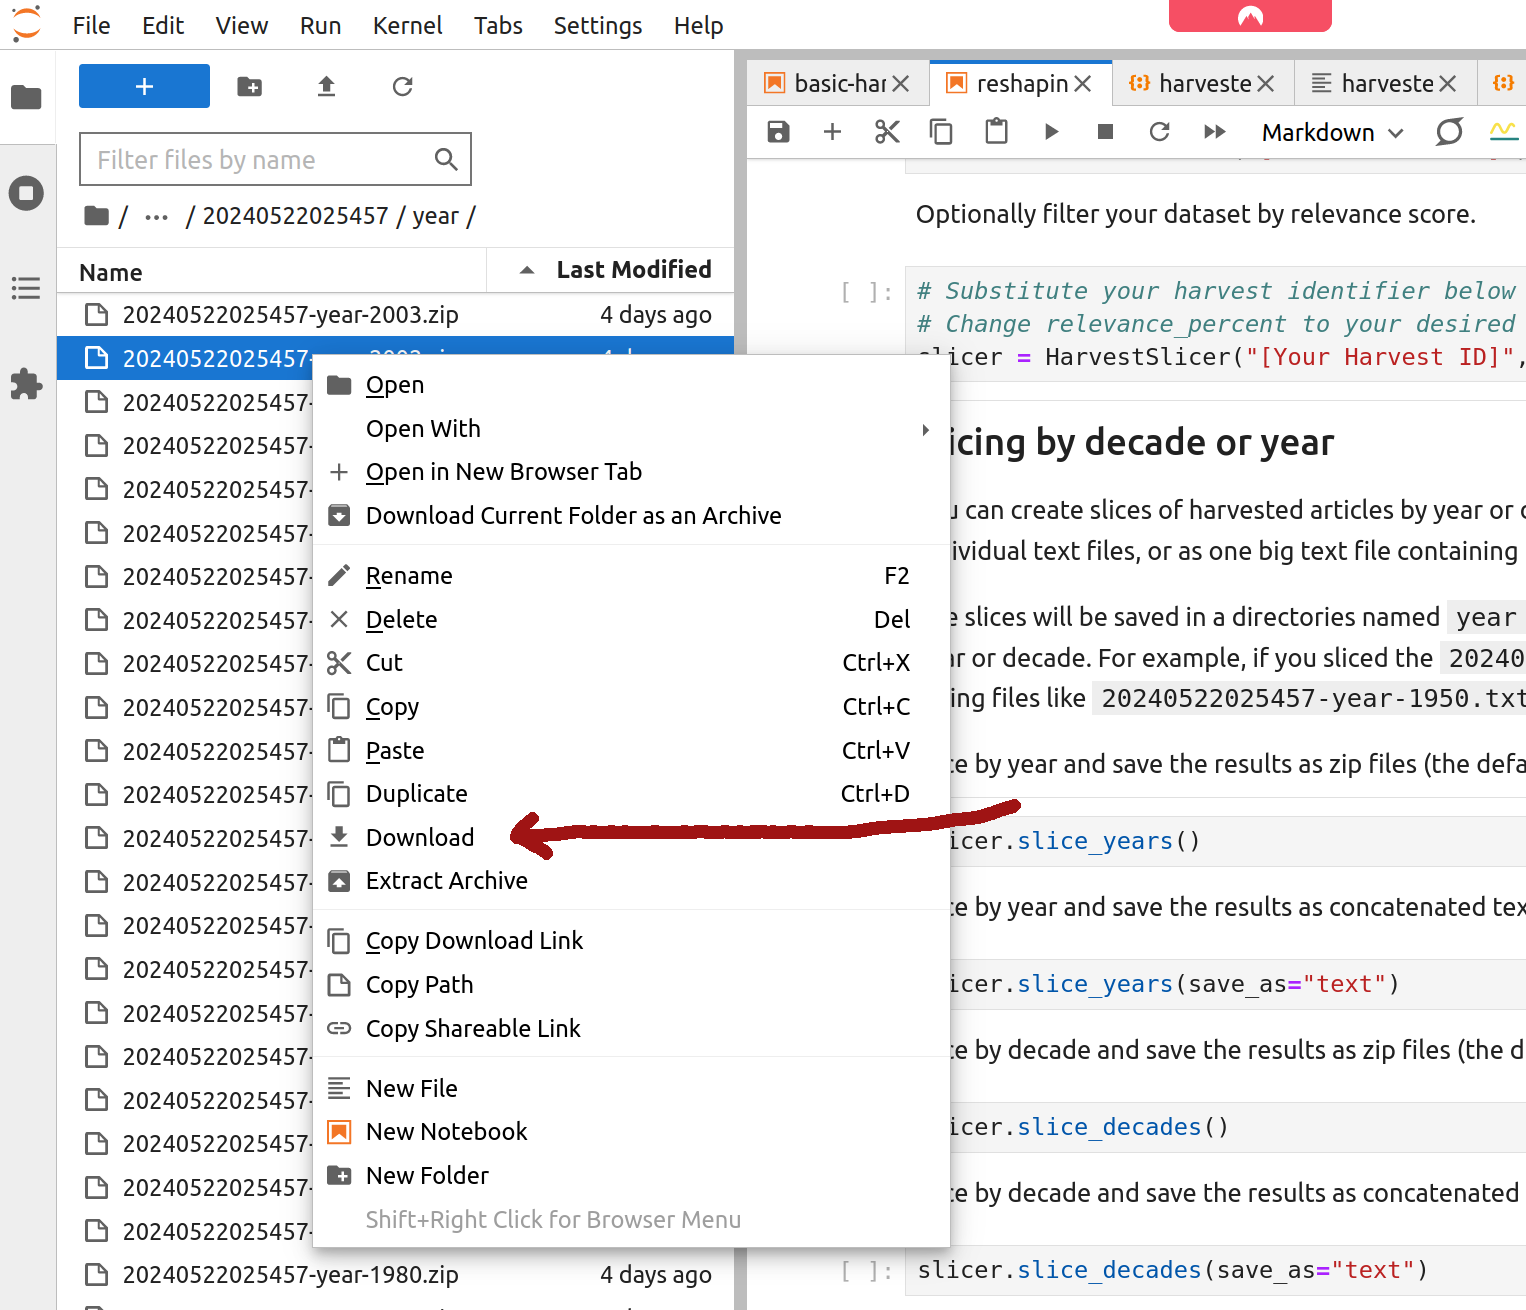
Fig. 27.24 Right click on a file and select ‘Download’.#
To download the complete directory as a single zip file, right click on the directory and select ‘Download as an Archive’.
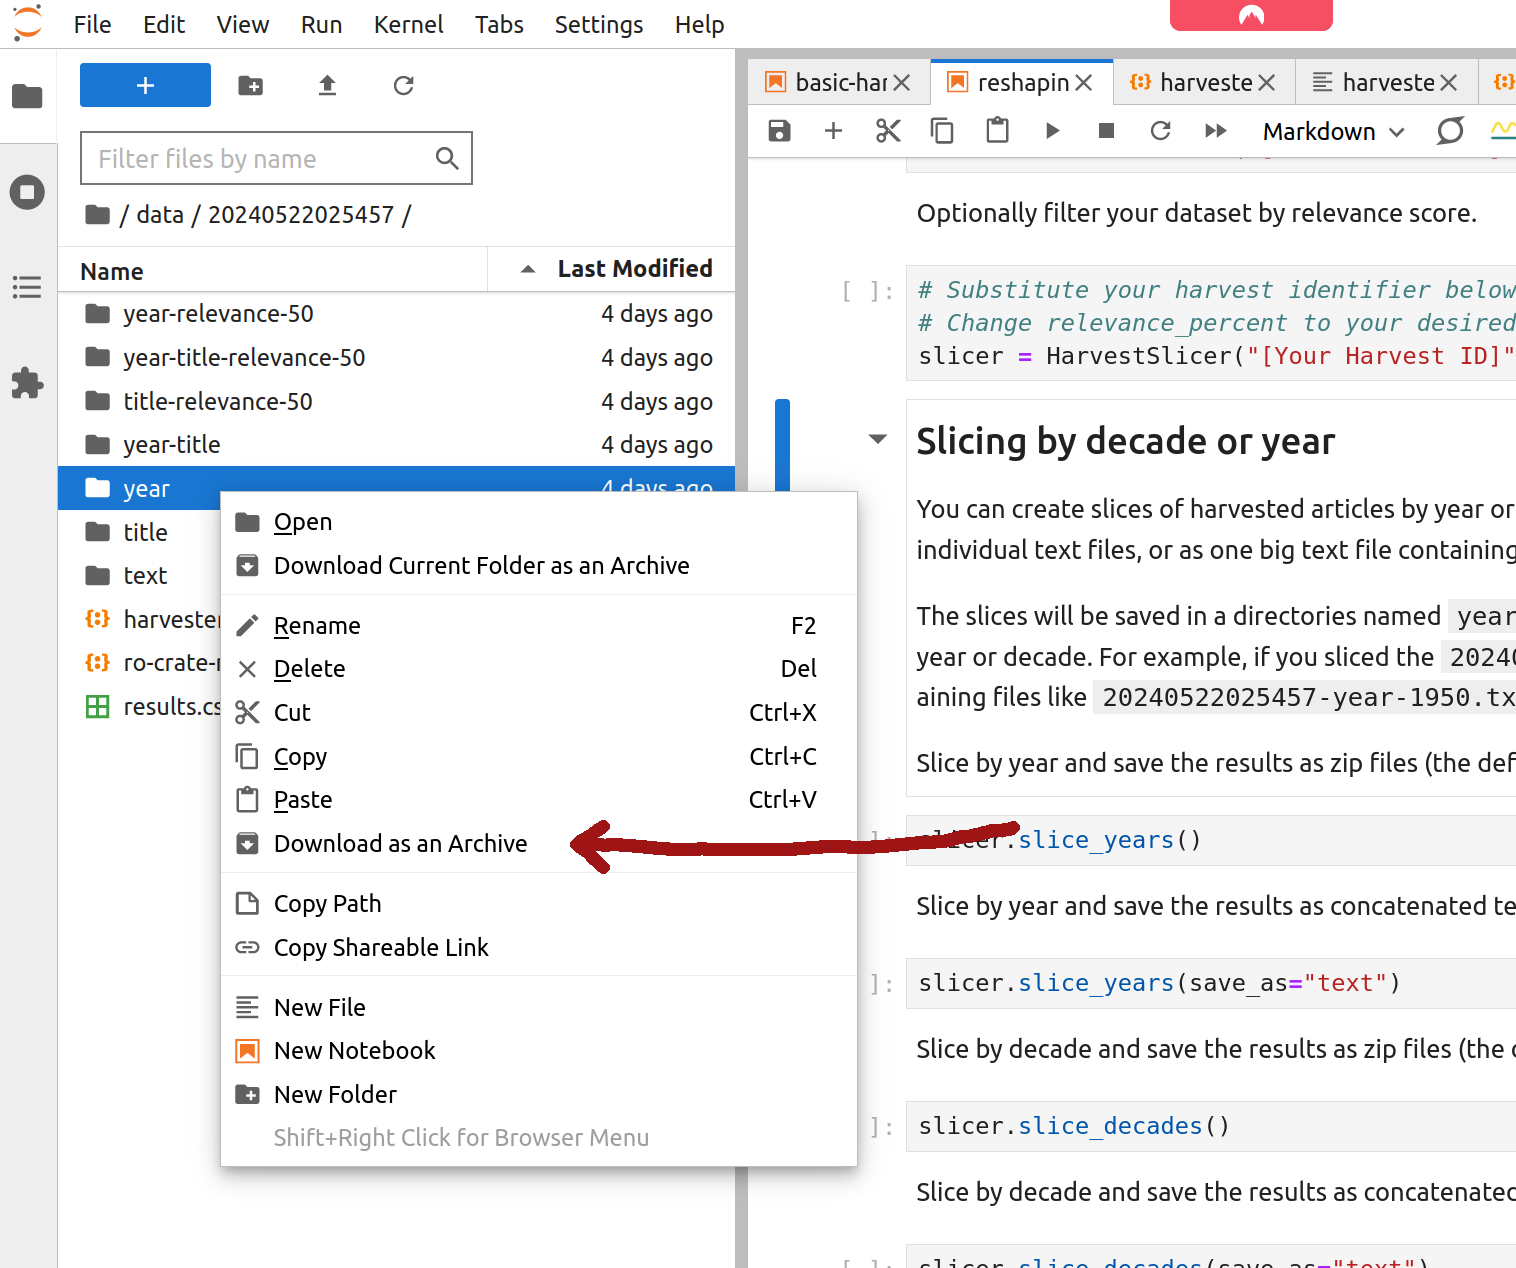
Fig. 27.25 Right click on a directory and select ‘Download as an Archive’.#
Keywords Analysis Tool#
The Australian Text Analytics Platform (ATAP) has created a Keywords Analysis Tool that helps you examine whether particular words are over or under-represented across two or more collections of text. The tool is available as a Jupyter notebook from ATAP’s GitHub repository. For an introduction to what the tool can do see this blog post. There’s also a detailed user guide (PDF).
Running the notebook#
ATAP uses its own BinderHub service, with a different authentication system. To get started, click on the ATAP BinderHub link. This will open a CILogon authentication page.
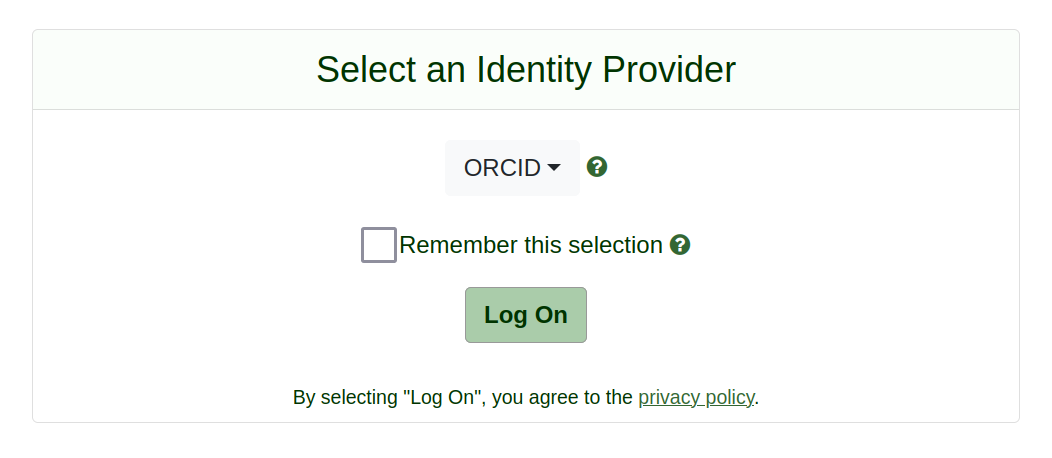
Fig. 27.26 Select an authentication provider from the dropdown list and click the Log on button.#
Click on the dropdown field to display a long list of authentication providers. If you don’t have an institutional login, you can use ORCID or Google. Once you’ve selected an authentication provider, click on the Log on button and follow the instructions. When the authentication process is complete, you’ll be redirected to the Keywords Analysis notebook running in Jupyter lab.
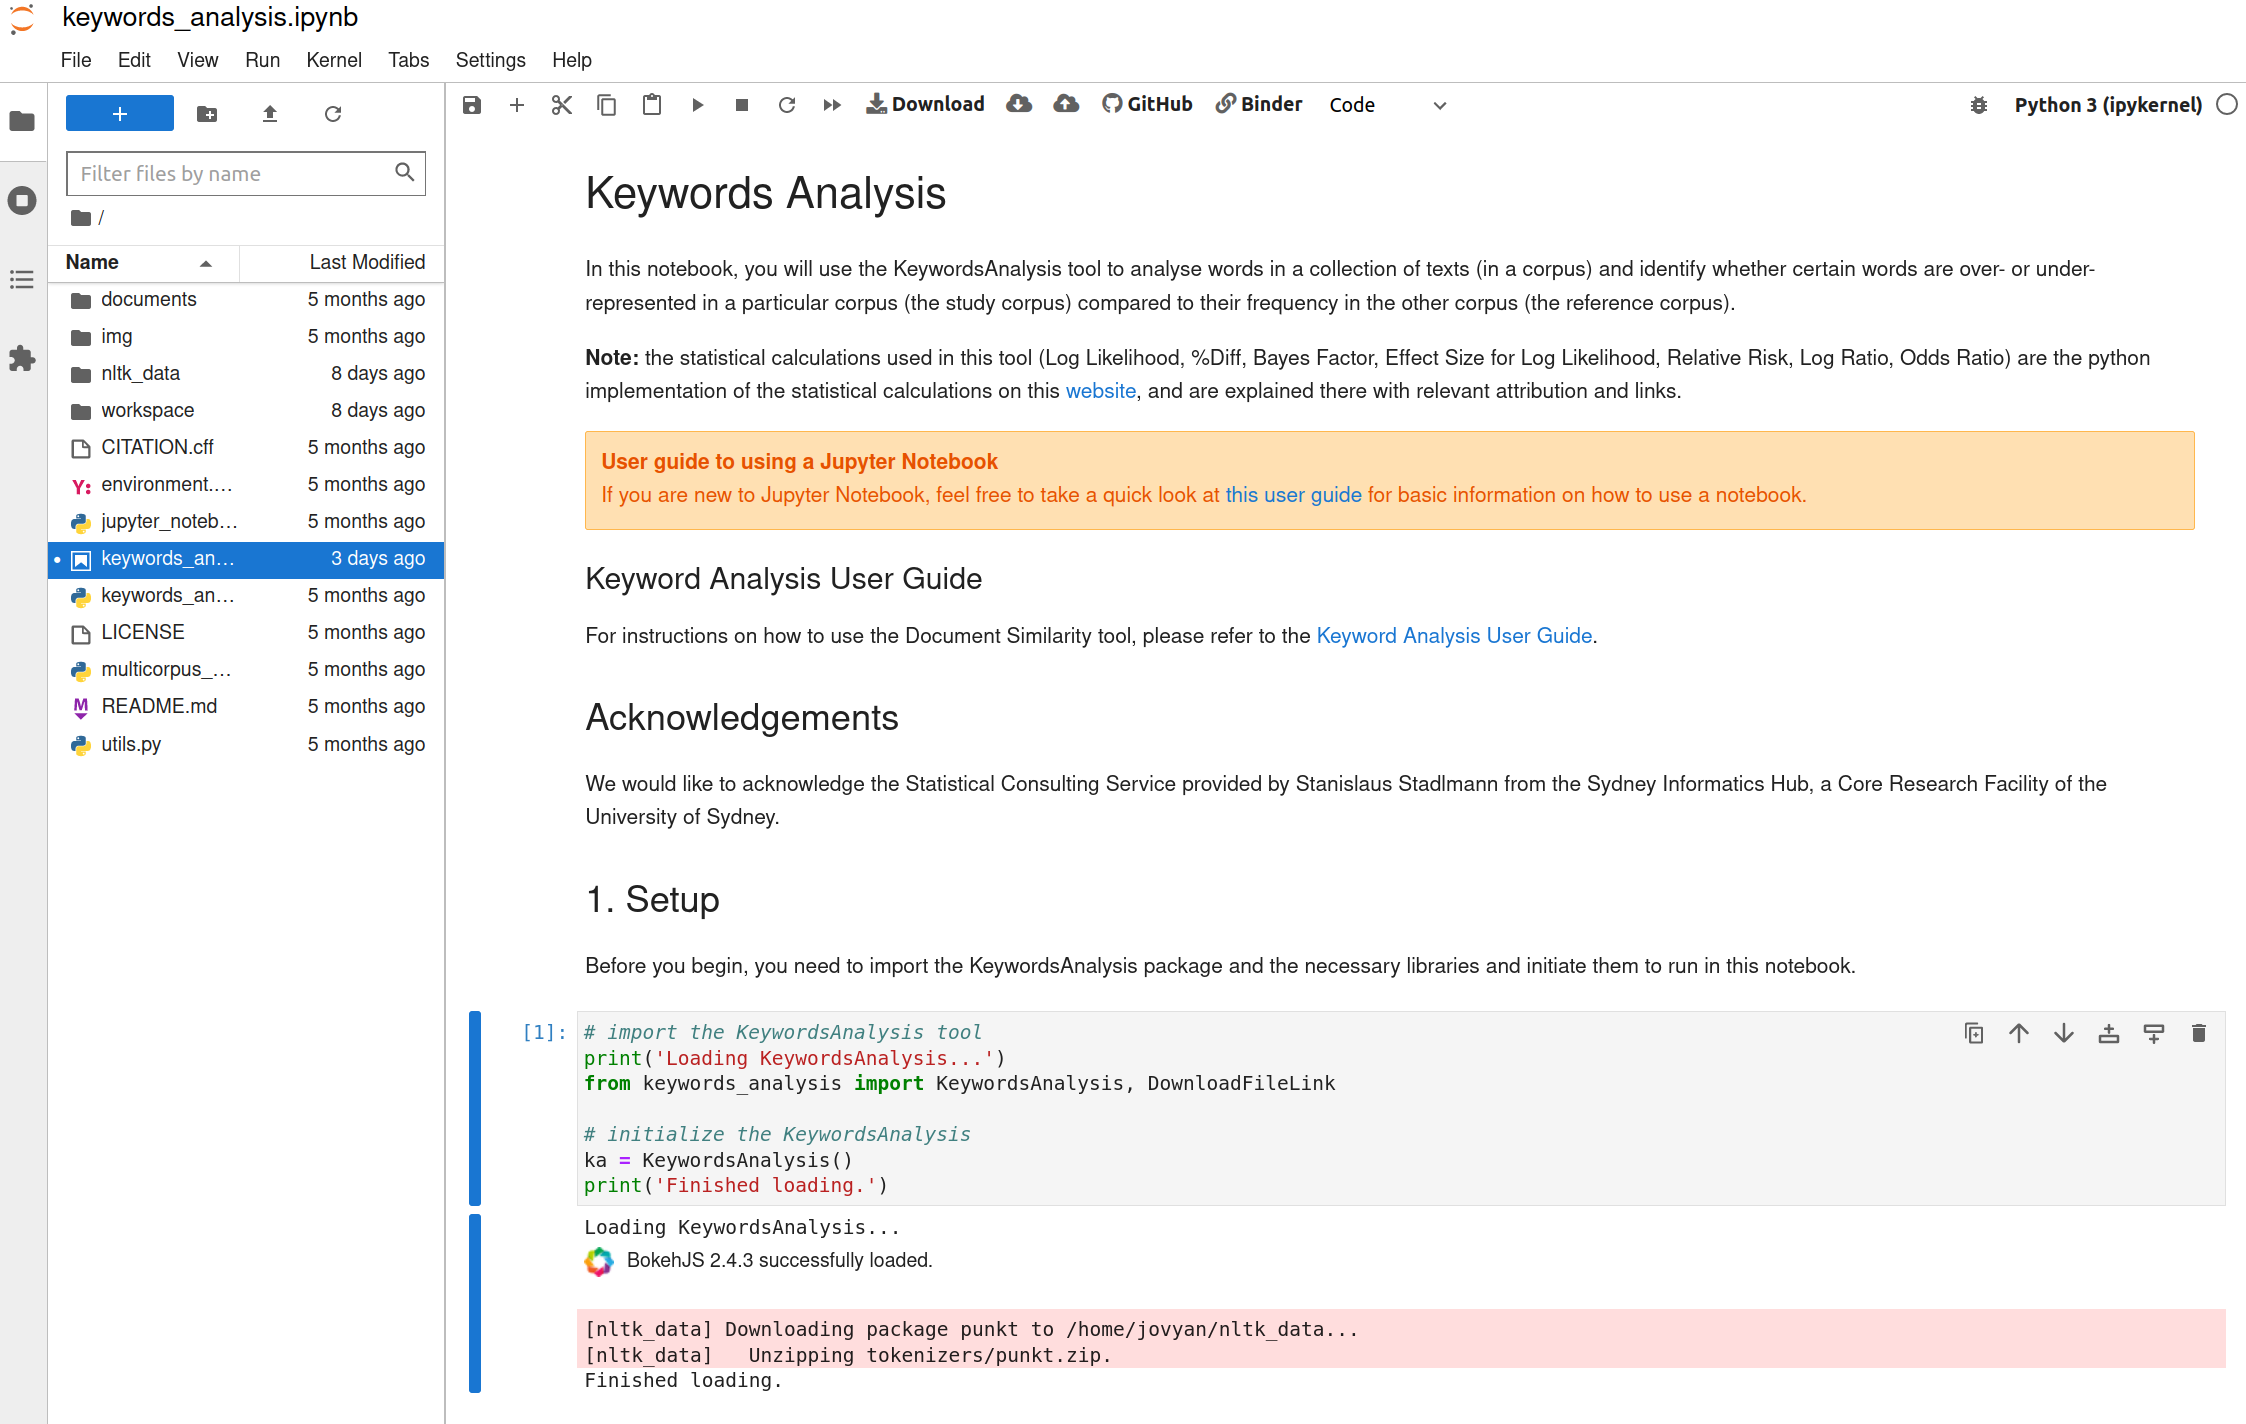
Fig. 27.27 ATAP’s Keyword Analysis notebook running in Jupyter Lab.#
When the notebook has finished loading, scroll down to the ‘Setup’ section. click on the code cell and hit SHIFT+ENTER to load and configure the KeyWord Analysis software.
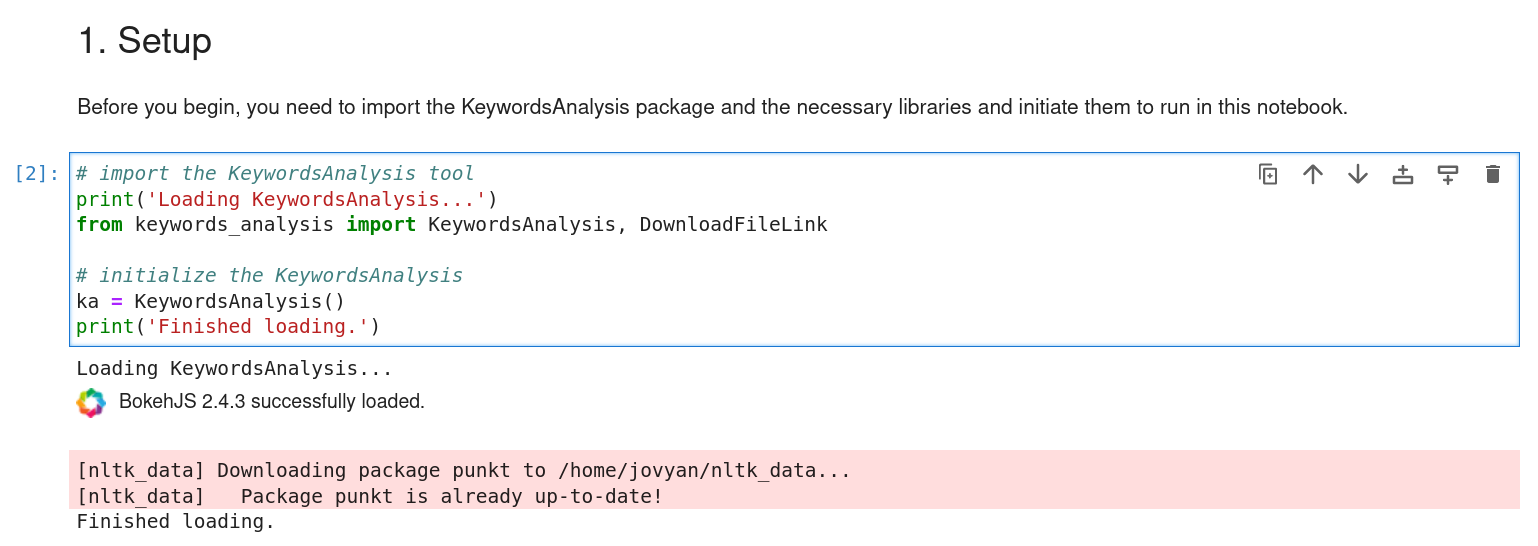
Fig. 27.28 Click on the code cell and hit SHIFT+ENTER.#
Loading your data#
Scroll down the notebook through the ‘Load data’ section until you see a cell containing the code ka.upload_file_widget(). Click on the cell and hit SHIFT+ENTER. A file upload widget will appear below the code cell.
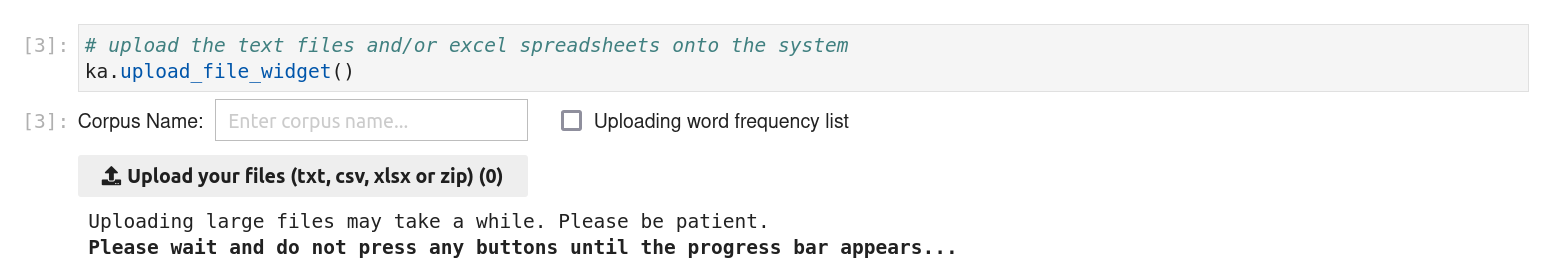
Fig. 27.29 Click on the code cell and hit SHIFT+ENTER to generate a file upload widget.#
Use the file upload widget to load your Trove newspaper data into the notebook. The notebook expects two or more text collections (or corpora) to compare. Using a sliced newspaper harvest you might, for example, decide to compare articles from 1900 with articles from 1950.
Use the ‘Corpus Name’ text box to give your first corpus a name, for example ‘1900’. Then click on the Upload your files button and select a slice you downloaded from the ‘Reshaping your harvest’ notebook. You can upload either text of zip files. Wait for a bit while the file is uploaded and processed. Eventually a progress bar will appear.
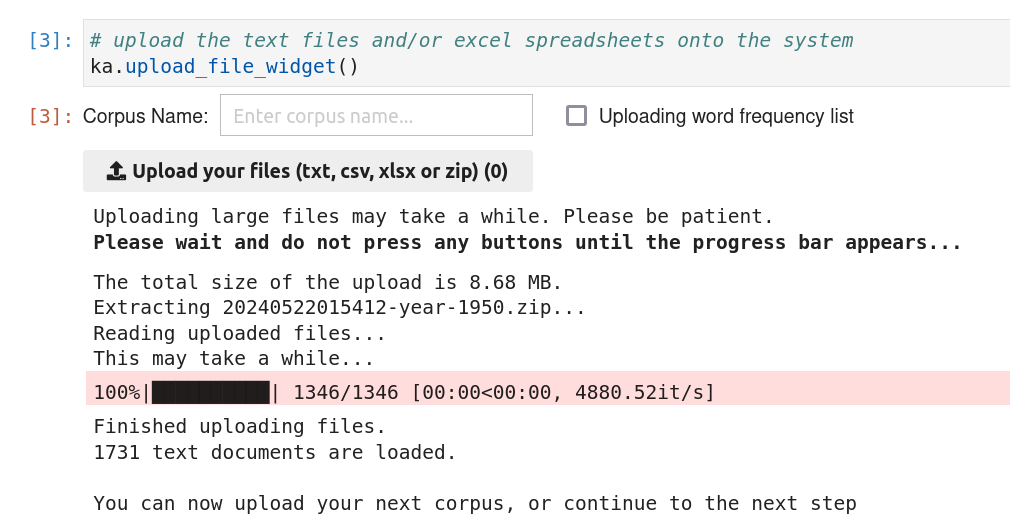
Fig. 27.30 Once you’ve uploaded a file, a progress bar will appear and the file will be processed.#
Repeat this process one or more times to add additional corpora for comparison.
Analysing the uploaded data#
Using the Keyword Analysis notebook you can:
compare corpora to see which words are over or under-represented in each dataset
generate word frequency statistics across the combined corpora
compare the frequency of particular words in different corpora
The notebook includes documentation describing each analysis and the statistical measures used. The user guide provides additional information.
Work your way through the notebook, running each code cell using SHIFT+ENTER. The code cells generate interactive widgets you can use to display word frequency charts and statistics.
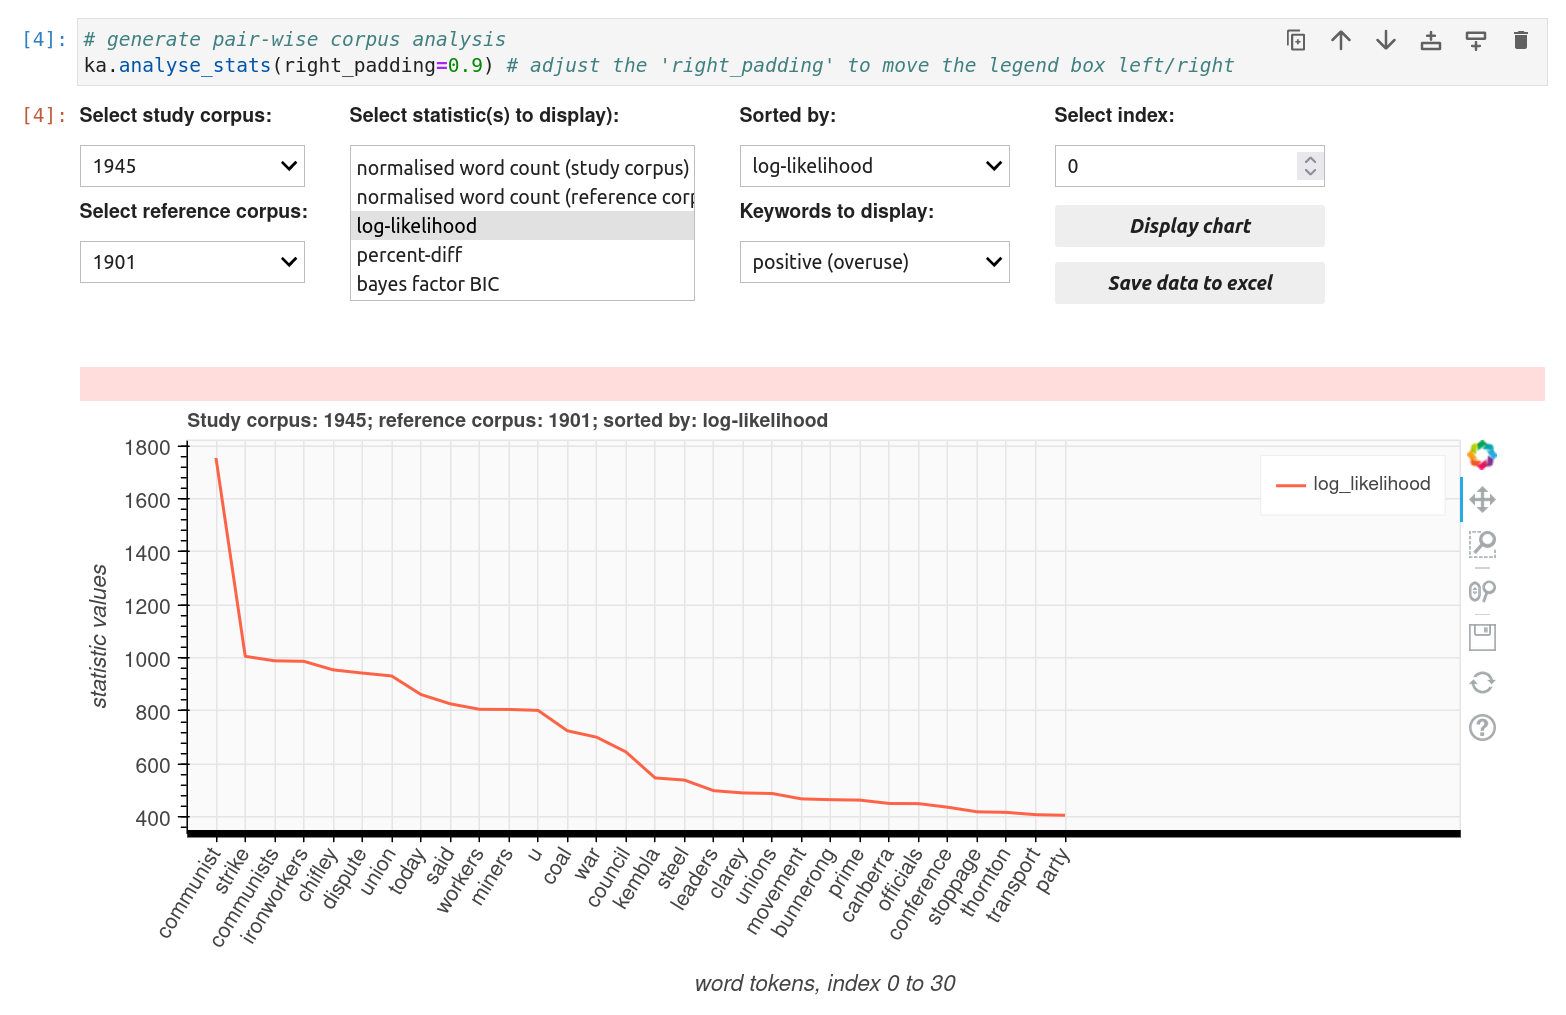
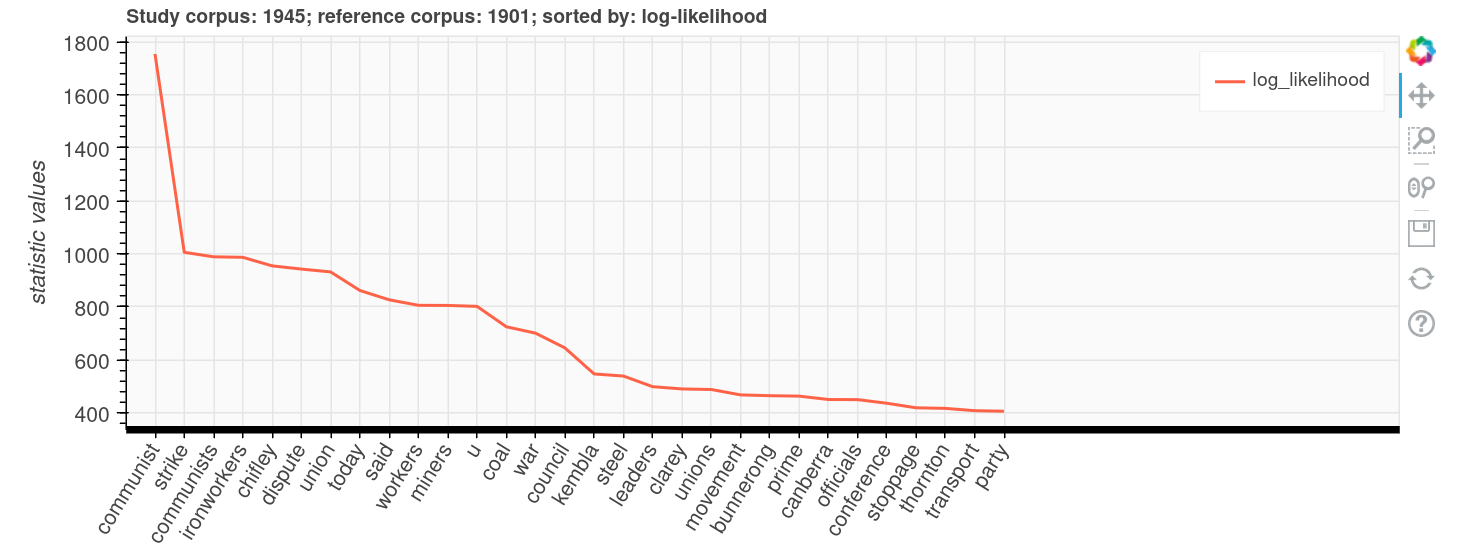
Fig. 27.31 Explore keyword frequencies using interactive widgets.#
If you want to restart your analysis using different datasets, select ‘Restart Kernel and Clear All Outputs’ from the ‘Kernel’ menu. Then go back to the top of the notebook and repeat the steps above to run the setup, and load your data.