29.2. Tools and resources#
This page includes information on tools and resources that you can use to analyse collection and system data from Trove.
ARDC Community Data Lab#
These tools are developed, maintained or supported by the Community Data Lab or other projects within the HASS&I Research Data Commons.

QueryPic visualises searches in Trove’s newspapers and gazettes, aggregating the number of results by day, month, or year. Simply copy and paste a url from a Trove web search to get started. QueryPic’s charts help you explore patterns and trends, and if you find something interesting you can click on a point to view the results in Trove for that time period.
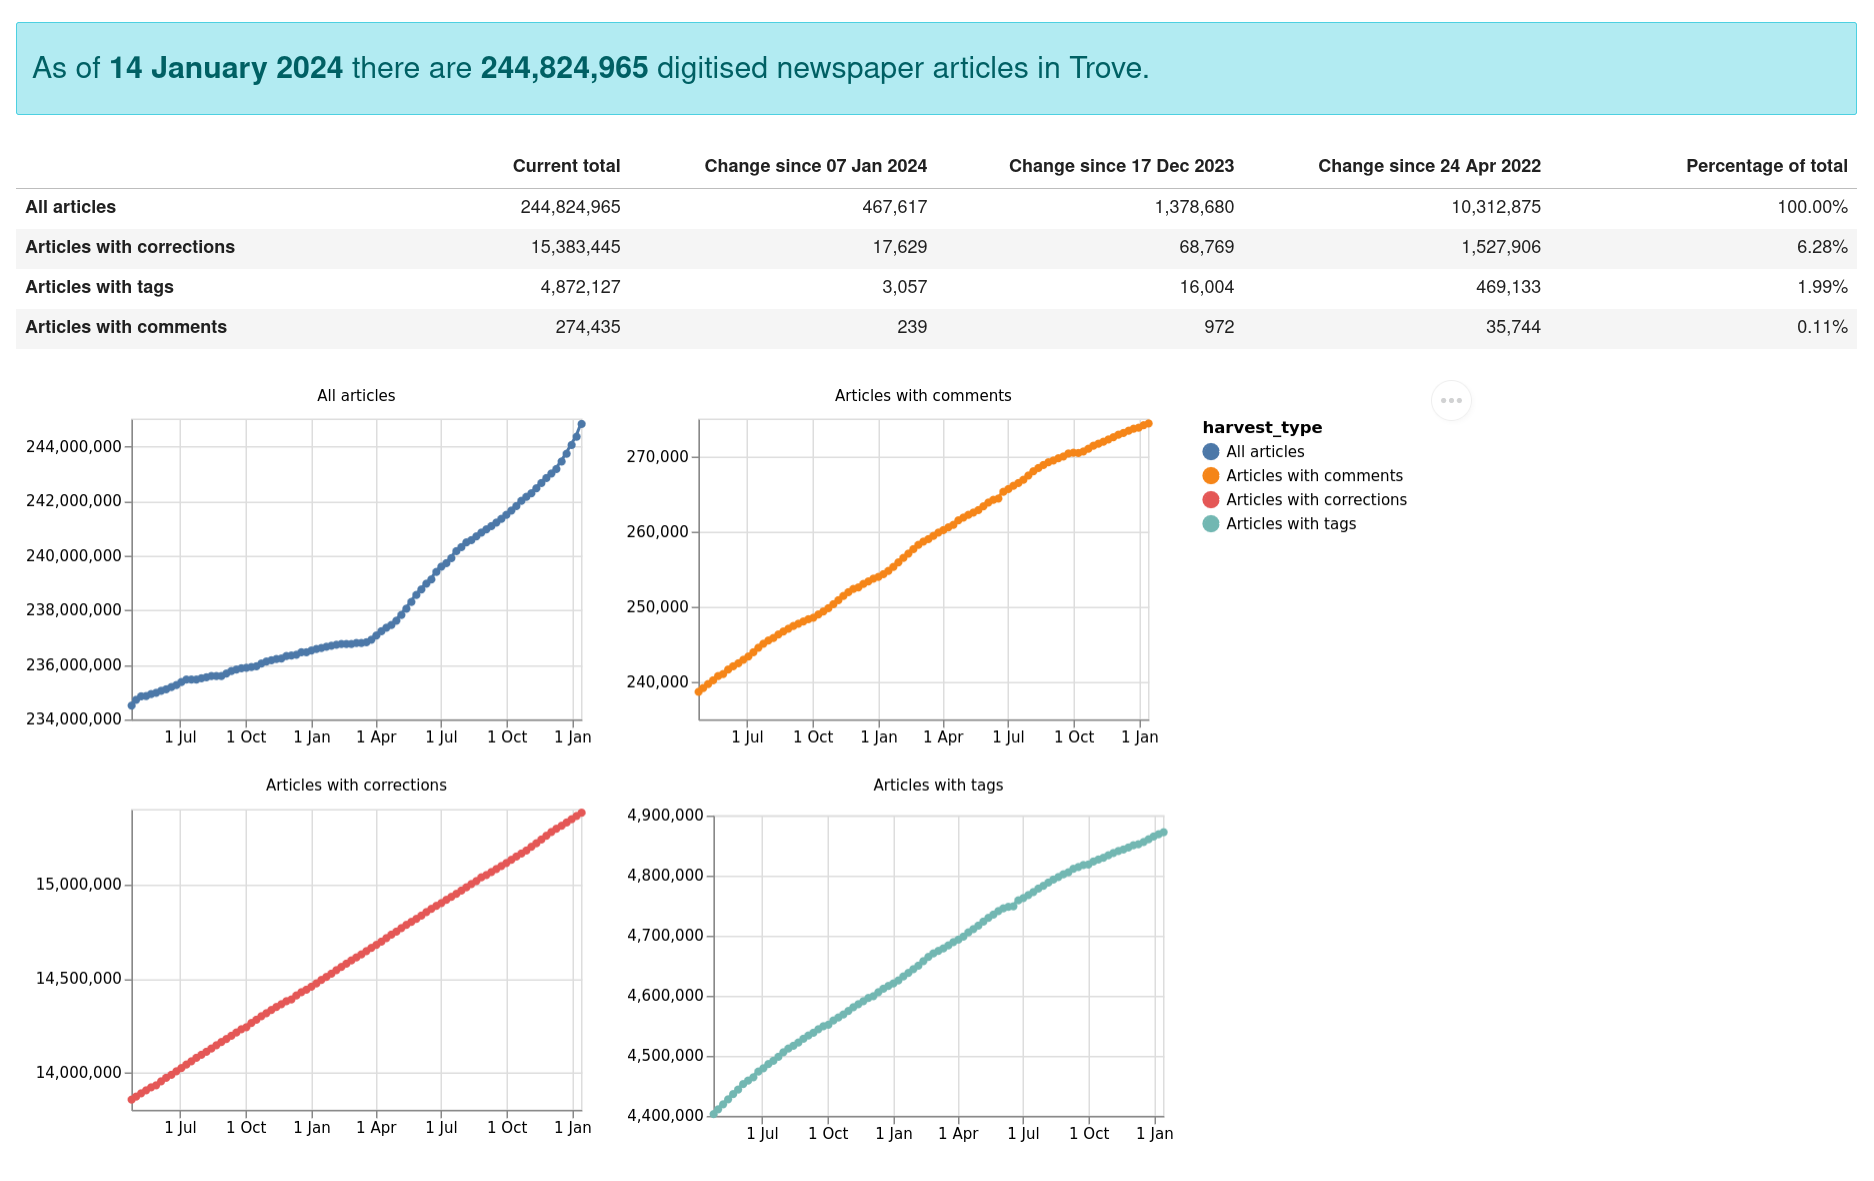
Trove’s collection of digitised newspapers is always changing – new articles and newspapers are being added by the NLA, while Trove users are busy correcting OCRd text and adding tags and comments. The search you run today might produce different results than the same query did a month ago, a year ago, or ten years ago. Researchers need to understand how these changes affect the queries they make, the results they find, and the arguments they construct. This dashboard helps researchers understand the context of their queries by presenting a snapshot of Trove’s digitised newspapers, based on weekly data harvests.